Share On Social!
This is part of our Sugary Drinks & Latino Kids: A Research Review »
Latino children consume less water than their peers
Research based on national NHANES data (2005-06, 2007-08, and 2009-10) has shown that water intakes among U.S. children ages 4-13 are below recommended levels.
Mexican-American children consumed less plain water than Non-Hispanic white children, on average, and children living in lower-income households were less likely to consume water as a beverage than those in high-income households.105
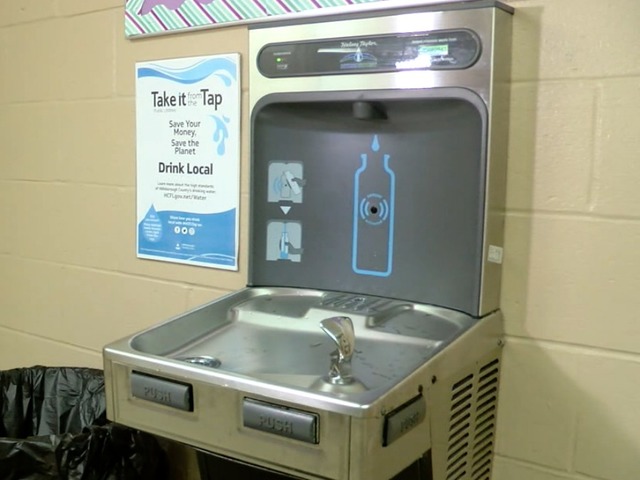
Studies have found that Hispanics are more likely to perceive tap water as unsafe and are less likely to drink tap water compared to Non-Hispanic whites.38,106–108
Recent NHANES data showed that over half (56%) of Mexican-American children consumed water from bottled sources rather than tap, compared to only 35 percent of Non-Hispanic white children.105
This raises questions around the accessibility of healthy alternatives to SSBs and whether this may play a role in the prevalence of SSB consumption.
In their analysis of national 2010 YouthStyles data, Onufrak and colleagues found that negative perceptions of the school water fountains were associated with SSB intake among Hispanics.106
A study of students in L.A. Schools (60% Latino), middle-school students’ perceived water to be warm, contain dirt/trash, or taste bad, and had greater odds of not drinking water.109
The impact of promoting water in schools
However, a 2016 study reviewing more than 1,227 elementary and middle schools in New York that banned sugary drinks and replaced vending machines with new water jets found students had a reduction in standardized BMI.
Water jets were associated with a 0.9 percentage point reduction in the likelihood of being overweight for boys and a 0.6 percentage reduction among girls.110
Pricing of bottled water
While bottled water may be widely available in food stores throughout the country—one national study found plain bottled water in 97 percent of 5,922 food stores observed in communities throughout the U.S.111—price may be an issue for some families and individuals.
As of January 1, 2014, 17 states and Washington, D.C imposed sales taxes on bottled water sold in food stores, and 34 had sales taxes on bottled water sold in vending machines.
In grocery stores, the average sales tax rate among states that do tax bottled water was 3.95 percent. In vending machines, the average sales tax rate among states that do tax bottled water was 5.04 percent.112
In February of 2015, a bill was introduced in Maryland (HB 261/SB 574) that would eliminate the 6 percent sales tax from bottled water sold at grocery stores and convenience stores.113
Finally, a study that used Nielsen Homescan data to estimate the potential impact of a SSB tax on household beverage purchasing found that bottled water was the strongest substitute for caloric sweetened beverages after a tax-induced 20-percent price increase on caloric sweetened beverages.2
Such substitution from sweetened beverages to bottled water (versus juice, milk, and other caloric beverages) would result in a net reduction in total daily calories.
Hence, it is important to acknowledge the price and accessibility of healthier substitutes, such as water, when considering the overall impact of a tax on SSBs.
More from our Sugary Drinks & Latino Kids: A Research Review »
- Introduction & Methods
- Key Research Finding: Latino kids’ sugary drink consumption
- Key Research Finding: Weight gain
- Key Research Finding: Marketing
- Key Research Finding: Childcare settings
- Key Research Finding: Pricing
- Key Research Finding: Water (this section)
- Policy Implications
- Future Research Needs
References for this section »
105. Drewnowski, A., Rehm, C. D. & Constant, F. Water and beverage consumption among children age 4-13y in the United States: analyses of 2005–2010 NHANES data. 85 (2013).
106. Onufrak, S. J. et al. Perceptions of tap water and school water fountains and association with intake of plain water and sugar-sweetened beverages. J Sch Health 84, 195–204 (2014).
107. van Erp, B. et al. Demographic Factors Associated With Perceptions About Water Safety and Tap Water Consumption Among Adults in Santa Clara County, California, 2011. (2014).
108. Gorelick, M. et al. Perceptions About Water and Increased Use of Bottled Water in Minority Children | Oct 03, 2011 | JAMA Pediatrics | JAMA Network. Available at: http://archpedi.jamanetwork.com/article.aspx?articleid=1107603. (Accessed: 24th August 2016)
109. Patel, A., Bogart, L., Uyeda, K. & Schuster, M. Los Angeles middle school students’ perceptions and consumption of drinking water in schools. (2009). Available at: https://www.researchgate.net/publication/266792608_Los_Angeles_middle_school_students%27_perceptions_and_consumption_of_drinking_water_in_schools. (Accessed: 11th October 2016)
110. Schwartz, A. E., Leardo, M., Aneja, S. & Elbel, B. Effect of a School-Based Water Intervention on Child Body Mass Index and Obesity. JAMA Pediatrics 170, 220 (2016).
111. Rimkus, L. et al. Beverage Availability in Food Stores Nationwide. (Bridging the Gap Program, Health Policy Center, Institute for Health Research and Policy, University of Illinois at Chicago, 2013).
112. Chriqui, J., Eidson, S. & Chaloupka, F. State Sales Taxes on Regular Soda-BTG Fact Sheet. Bridging the Gap Program, Health Policy Center, Institute for Health Research and Policy, University of Illinois at Chicago (2014). Available at: http://www.bridgingthegapresearch.org/research/sodasnack_taxes/.
113. Bourg, A. Advocates pushing to reduce sugar consupmtion by children in Maryland. ABC 2 News WMAR (2015). Available at: http://www.abc2news.com/news/health/advocates-pushing-to-reduce-sugar-consupmtion-by-children-in-maryland. (Accessed: 23rd August 2016)
114. Adeigbe, R. T., Baldwin, S., Gallion, K., Grier, S. & Ramirez, A. G. Food and Beverage Marketing to Latinos A Systematic Literature Review. Health Educ Behav 42, 569–582 (2015).
115. Hoog de, M. L. et al. Racial/ethnic and immigrant differences in early childhood diet quality. Public Health Nutrition 17, 1308–1317 (2014).
By The Numbers
1
Supermarket
for every Latino neighborhood, compared to 3 for every non-Latino neighborhood