Share On Social!
Inadequate transportation can hurt a person’s social, economic, and health outcomes.
But planners and policymakers have not had a good tool to measure transportation insecurity—a condition in which one is unable to regularly move from place to place in a safe or timely manner due to the absence of the material, economic, or social resources needed for transportation.
So, in 2018, researchers from University of Michigan and others created a tool to explore transportation security modeled after the Food Security Index and based on interviews with families living in poverty.
They call it the Transportation Security Index.
In 2021, they validated the 16-question index using a nationally representative sample.
“We hope [the Transportation Security Index 16] will be adopted by scholars across academic disciplines, policymakers, and planners and deepen our understanding of the relationship between transportation insecurity and poverty,” the researchers, Alix Gould-Werth, Jamie Griffin, and Alexandra K. Murphy wrote in the latest publication.
Why Typical Measures of Transportation Barriers Fail
Most who work in health promotion, poverty reduction, and community and transportation planning recognize that inadequate transportation negatively impacts social, economic, and health outcomes.
But few understand the full extent.
For example, the most explored intersections between transportation and health are:
- Access to medical care and medications
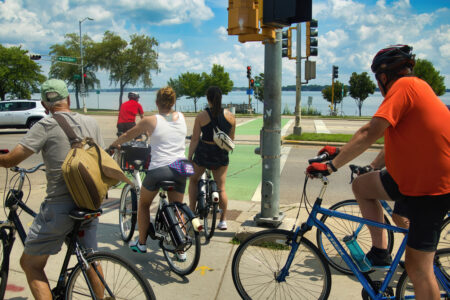
- Walking and biking for physical activity
- Traffic deaths and injuries
- Air pollution and greenhouse gas emissions
These are important intersections.
However, they are unable to fully provide the depth and detail needed to understand the various manifestations of inadequate transportation.
The problem is that planners and policymakers often rely on a few simple measures of vehicle ownership, commute time, access to medical care, or neighborhood characteristics—like the presence of transit—to determine transportation barriers.
“For example, some of the most prominent surveys that poverty and inequality researchers draw upon ask a single question about transportation access: “Do you or anyone else in your family living here own or lease a car or other vehicle for personal use? (Yes/No)”,” according to Gould-Werth, Griffin, and Murphy.
This fails to reveal how transportation barriers manifest in day-to-day life.
For example, manifestations of inadequate transportation include:
- Losing wages or getting fired due to being late to work because of infrequent buses or unreliable personal vehicles
- Getting denied care at the doctors or denied resources at social services offices due to being late or missing appointments because of depending on friends and family to provide rides
- Foregoing spending on essentials, like food and medications, due to the cost of vehicle ownership because of lack of options to get around without a personal vehicle
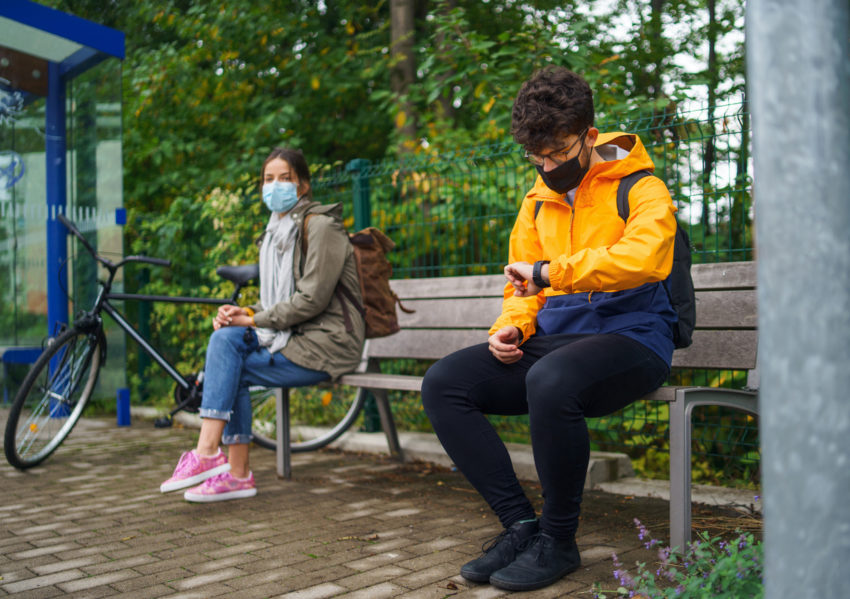
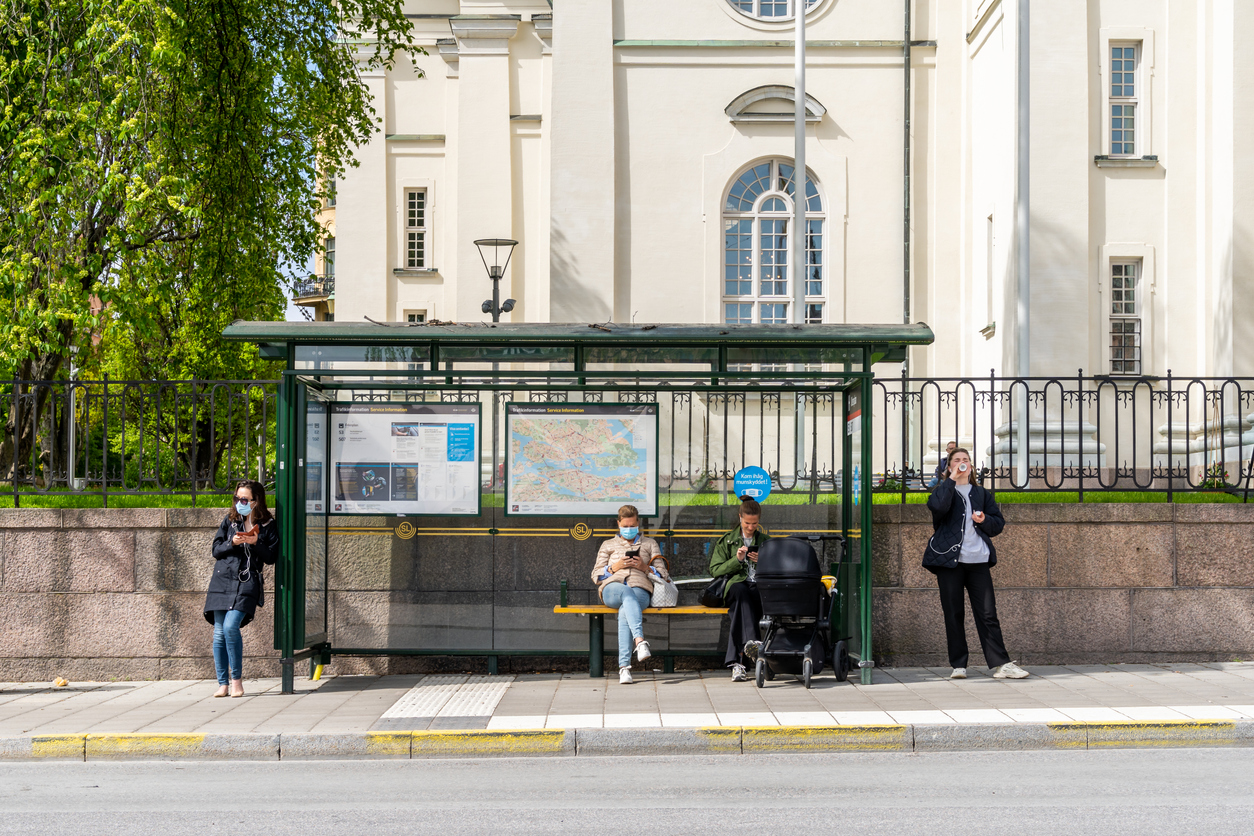
- Foregoing trips to resources and services, like workforce training and healthy cooking classes, due to spending a long time waiting or traveling because of multiple bus transfers
- Lack of community cohesion due to feeling socially isolated because of lack of safe, affordable options to get around
- Feeling bad about inconveniencing friends, family, and neighborhoods due to needing help with transportation because of various transportation barriers
- Worrying about all of the above
Beyond limited understanding of these manifestations is also limited understanding about the social, economic, and health impacts of these manifestations.
For example, health is at stake when inadequate transportation results in skipping a trip to the doctor or grocery store or getting fired from a job.
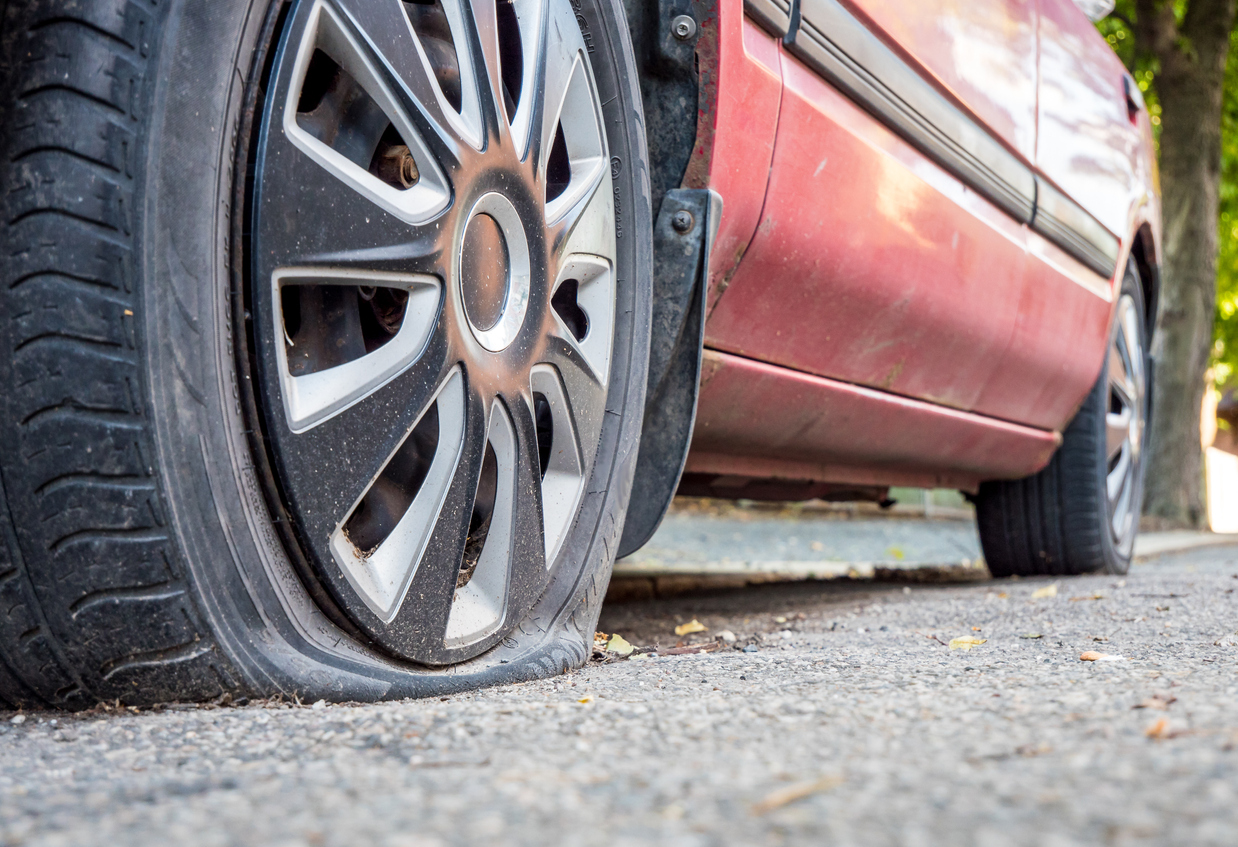
Not many studies have uncovered how the cost of vehicle ownership can force families into unfair, risky tradeoffs between repairing a vehicle and investing in health, education, and wealth.
Households spent an average of $9,737 on transportation in 2017, according to the Bureau of Transportation Statistics.
Americans are forced to pay for personal vehicles just to get to work, school, the doctor, and the grocery store because cities have failed to provide people with options.
It is also important to note that although household spending on vehicles is considered an investment by the Bureau of Transportation Statistics because vehicle are storable and have an average life of at least three years, “vehicles are depreciating assets, so their value is almost never regained upon resale,” according to a blog post from the Institute for Transportation and Development Policy.
This is particularly relevant because people with the lowest incomes are hardest hit by transportation costs, a fact that can get lost when only reporting absolute transportation spending.
To be considered affordable, transportation should account for less than 15% of annual income, but some low-income households are spending far more, leaving less at the end of the month to invest in health, education, and wealth.
This cost burden exists because American cities have been designed to require vehicle ownership to participate in social, economic, and political society.
Only recently has transportation spending as a share of household income gained popularity thanks to the Center for Neighborhood Technology.
You can explore transportation cost-burden in your city using their Housing + Transportation Affordability Index.
This index was used to develop the the Location Affordability Index, which was temporarily adopted by the U.S. Department of Transportation (USDOT) and the U.S. Department of Housing and Urban Development (HUD). However, HUD no longer supports the user-friendly portal to make this data available to the public.
However, few transportation planners consider transportation cost-burden in the planning process.
This indicator is not included in project prioritization criteria or in community impact assessment criteria.
And because there is no well-established index of transportation insecurity, planners, policymakers, and scholars often fail to consider the real-life manifestations when people are burdened by unaffordable, inadequate, unsafe, and unreliable transportation.
That’s where researchers in Michigan come in.
Transportation Security Index
After years of interviewing low-income residents in Pittsburgh and workers who recently lost their job in Detroit, Gould-Werth of the Washington Center for Equitable Growth and Murphy of the University of Michigan discovered that residents faced big transportation issues.
Some people skipped trips to important places. Some faced strained relationships with ride-givers.
Because no single measure existed to capture the multiple manifestations of transportation insecurity, Gould-Werth and Murphy began to draft a list of potential questions modeled after the Food Security Index.
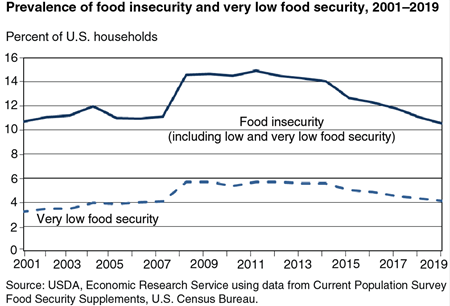 The Food Security Index was created after Congress passed an act in 1990 requiring the U.S. Department of Agriculture (USDA) to establish and implement a plan and stimulate research necessary to develop standardized methods to assess the dietary and nutritional status of Americans.
“Food security means access by all people at all times to enough food for an active, healthy life,” according to the USDA.
USDA staff reviewed literature and developed a national measure of food insecurity in 1995, which the U.S. Census Bureau administered as a supplement to the Current Population Survey.
Although the index has undergone numerous tests of validity and subsequent refinements, organizations and local governments are able to collect data on and track food insecurity at local, state and national levels.
Gould-Werth and Murphy wanted to develop a single, standardized measure of transportation security at the individual level so scholars and practitioners from a wide range of disciplines can collect data on transportation insecurity.
They want to be able to investigate:
- How many people experience transportation insecurity
- Which demographic groups experience transportation insecurity
- What causes transportation insecurity
- What are the consequences of transportation insecurity
- What role does transportation insecurity play in the reproduction of poverty
A standardized tool is important for nationwide comparisons.
They circulated the list of questions to qualitative researchers, service providers, and people with low incomes.
Based on the input they received, they revised the questions.
Then they interviewed 52 socioeconomically and demographically diverse people in Chicago and Michigan.
They coded and analyzed the responses. Based on their findings, they revised the questions again, resulting in 23 potential questions for the Transportation Security Index.
Next, it was time to administer the questionnaire.
In 2016, Gould-Werth and Murphy recruited a diverse population of low-income residents to complete the questionnaire.
They analyzed the results, and because there is no current gold standard measurement of transportation security, they manually classified respondents as likely secure or insecure using items that were not part of the index, such as income greater than $75,000, owning a vehicle, and not having a disability.
Based on their findings, they identified 16 questions. In 2018, they released their methods, findings, and preliminary 16-question Transportation Security Index.
 They define transportation insecurity as the condition in which a person is unable to move from place to place in a safe or timely manner due to the absence of needed resources for transportation.
But they aren’t done.
In 2018, Gould-Werth, Griffin, and Murphy validated the 16-question index using a nationally representative sample. In 2021, they released their methods, findings, and a slightly modified 16-question Transportation Security Index (TSI16).
Questions in the TSI16 include:
- In the past 30 days, how often were you late getting somewhere because of a problem with transportation?
- In the past 30 days, how often did you have to reschedule an appointment because of a problem with transportation?
- In the past 30 days, how often did you skip going somewhere because of a problem with transportation?
- In the past 30 days, how often were you not able to leave the house when you wanted to because of a problem with transportation?
- In the past 30 days, how often did you feel left out because you did not have the transportation you needed?
- In the past 30 days, how often did you worry about inconveniencing your friends, family, or neighbors because you needed help with transportation?
“As currently presented, the TSI16 is a continuous measure that conceptualizes transportation insecurity as occurring along a continuum—higher scores reflect greater insecurity (or less security) and lower scores reflect less insecurity (or greater security)” the researchers said.
The researchers recognize that a 16-question measure is too long for inclusion in many sample surveys at national, state, and local levels. So they are currently developing a short form.
They also recognize new data will need to be collected to determine how the index performs with other data collection modes and with other populations.
Share this with policymakers, planning practitioners and scholars, public health leaders, and organizations serving those living poverty.
Urge them to explore the symptoms of inadequate transportation by including the Transportation Security Index in data collection efforts.
You can also urge the U.S. Department of Transportation to consider stimulating research in and requiring the development of standardized methods to assess transportation insecurity.
How Can You Push for More Equitable Systems in Your Area?
Download the Salud America! Health Equity Report Card for your area!
The Report Card auto-generates Latino-focused and local data with interactive maps and comparative gauges, which can help you visualize and explore inequities in housing, transportation, poverty, health care, food, and education.
You will see how your county stacks up in these health equity issues — now including social vulnerability and COVID-19 — compared to your state and the nation.
Then you can share the Report Card with your local leaders to advocate for healthy change!
Get your Health Equity Report Card!
Revised 11/12/2021 to remove the following due to the conflation of data sources used by the Bureau of Transportation Statistics to report this: Transportation is the fourth largest household spending category after healthcare, housing, and food.
Revised 11/12/2021 to remove the following due to my miscalculation: in the lowest income quintile, the average household income was $14,000 in 2017. The average spending on transportation was $3,497. This means the lowest income Americans are spending roughly 24% of their household income on transportation.
Revised 11/12/2021 to add the following: This index was used to develop the the Location Affordability Index, which was temporarily adopted by the U.S. Department of Transportation (USDOT) and the U.S. Department of Housing and Urban Development (HUD). However, HUD no longer supports the user-friendly portal to make this data available to the public.
By The Numbers
27
percent
of Latinos rely on public transit (compared to 14% of whites).