
Share On Social!
During rush hour, the eight-lane Mississippi River Bridge in Minnesota collapsed, killing 13 people, and injuring over 140 more on Aug. 1, 2007.
This tragedy was a wake-up call for officials in the Minneapolis-St. Paul “Twin Cities.”
They could not afford to build their way out of congestion or repair the state’s deteriorating transportation infrastructure.
To achieve safe transportation improvements for a growing population, the Twin Cities’ Metropolitan (Met) Council began to transition away from policies that move vehicles to ones that move people.
The evolution began by rethinking how to measure road performance, according to a case study of the Met Council by the U.S. Department of Transportation (USDOT).
Motivation to Change
The bridge collapse highlighted costs to maintain and expand highway systems for Met Council and the Minnesota Department of Transportation (MnDOT).
Even with strong political and public support to continue prior funding levels, there would not be enough money to address growth.
For example, if funded by the state gas tax alone, the required investment to “fix” congestion would add more than $2 per gallon.
They needed to figure out to move more people while using the same highway system — so, they introduced new performance metrics.
Out with Old Road Performance Measures
Levels of Service (LOS) metrics are intended to represent a traveler’s perception of quality of service on a given roadway by measuring congestion and travel delay.
For instance, a roadway segment is graded “A” if general operating conditions are free-flowing, with low volumes, and high speeds. A road segment is graded “F” if general operating conditions are forced, experience breakdown flow, unacceptable congestion, and stop-and-go.

LOS can be evaluated based on passenger cars per mile lane, volume-to-capacity ratios, average travel speeds, and maximum service flow rates.
This metric tool was first introduced in the 1965 Highway Capacity Manual (HCM), according to the U.S. Department of Transportation (USDOT).
Although no federal highway design regulations require the use of LOS targets, some states and local transportation decision makers mistakenly perceive its use as federally required.
Responding to mistaken perceptions, the Federal Highway Administration (FHWA) published a memo in May 2016 clarifying that, “FHWA does not have regulations or policies that require specific minimum LOS values for projects on the NHS.”
Transportation system performance is far more complex than volume-to-capacity ratios and average travel speeds.
As the transportation industry broadens its goals beyond congestion reduction and associated capacity expansion, the role of LOS as a performance metric will become increasingly limited.
“Communities that have adopted goals such as improving safety for other roadway users (e.g., pedestrians, bicyclists, and transit users), or encouraging infill development, find that the way LOS standards are traditionally used is not helpful in reaching those goals,” the case study states.
Therefore, USDOT has provided greater flexibility in how states and localities can meet objectives through design, operations, and process.
In with New Road Performance Measures
In 2007, Met Council began introducing new metrics—people-moving capacity and person throughput—into their long-term initiative, the 2030 Transportation Policy Plan.
The 2010 Metro Highway System Investment Study provided a list of guiding principles to assist in the evaluation of alternative projects and approaches. One suggestion states: “Highway improvements should enhance and support transit use where existing or planned express transit service exists.”
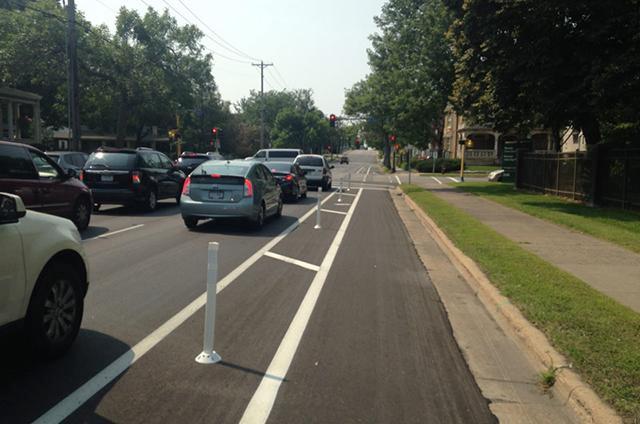
By 2015, Met Council was focusing on managing congestion with “innovative, cost-efficient” approaches, maintaining existing infrastructure, and investing in multimodal travel options to achieve sustainable growth.
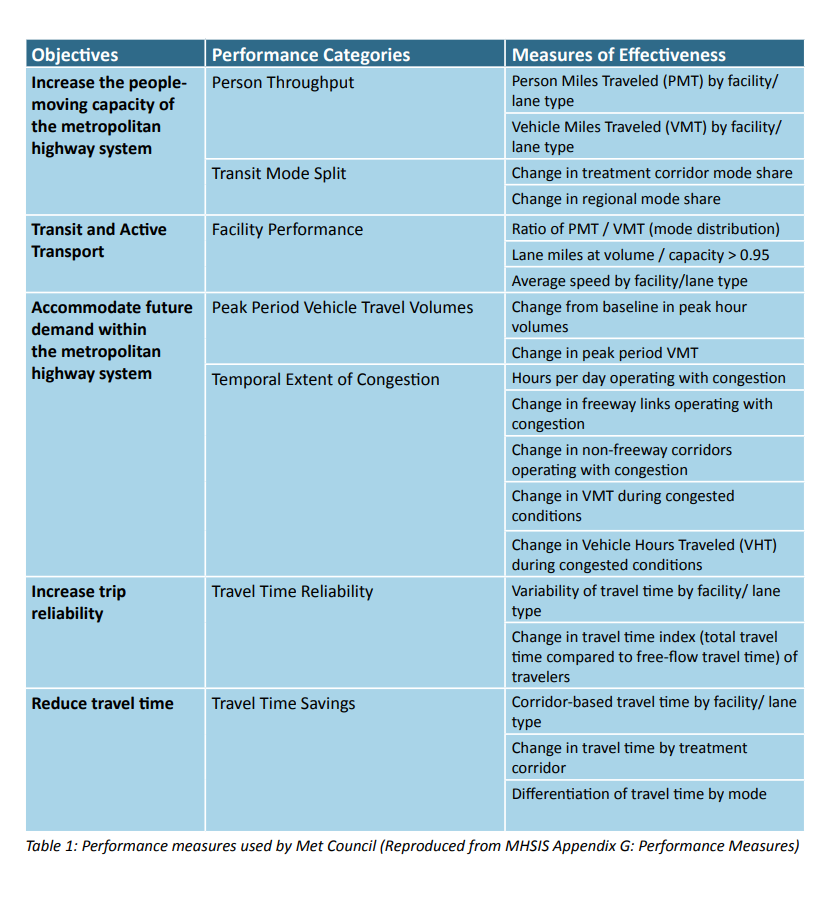
The volume-to-capacity ratio, the metric tool used to discover problems, is now one of 19 performance measures in the 2040 Transportation Policy Plan.
 If the volume-to-capacity ratio is too high, for example, projects may reduce volume through transportation demand management or expand capacity through higher-occupancy vehicles, rather than adding vehicle land-miles.
Moreover, the regional solicitation process for allocating federal funding was revised to ensure that the criteria for scoring, measuring, and designing are consistent with the goals of increasing the highway system’s people-moving capacity.
The regional solicitation process includes prioritization criteria that align with the regional plans, including equity, affordable housing, and emissions reductions.
Lessons Learned
Met Council gained a breadth of knowledge through their projects.
- Financial constraints may force an agency to seek alternative performance measures to managing congestion.
- LOS and volume-to-capacity ratios are now used primarily as systematic indicators of congestion.
- Performance metrics that focused on existing transportation capacity enabled the region to create more affordable projects while maintaining service expectations.
- Asymmetric or spot improvements may mitigate congestion without inducing travel.
- Stakeholders are more focused on strategies and solutions than on new performance measures.
Share this with local and state agencies to start or support similar transitions away from LOS to improve regional mobility.
Ask to shift from policies that move vehicles to policies that move people.
By The Numbers
27
percent
of Latinos rely on public transit (compared to 14% of whites).