Share On Social!
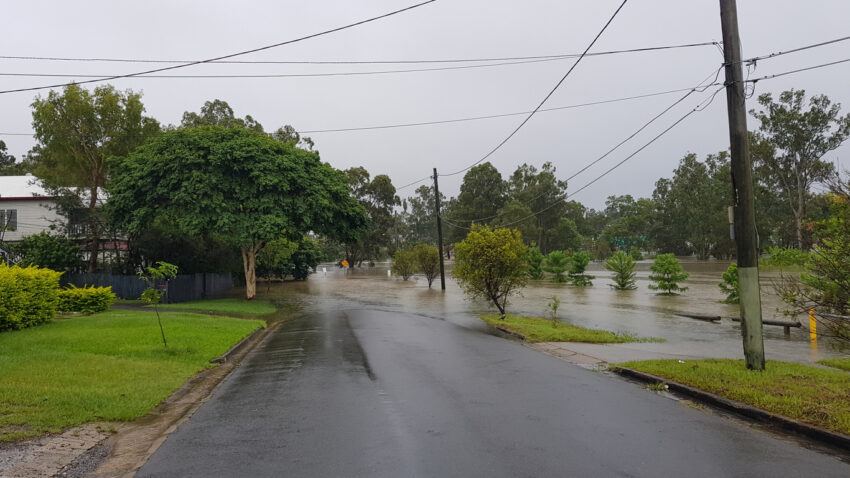
Climate change threatens communities by worsening air quality and increasing chronic disease risk and intensifying deadly storms, droughts, and heat waves.
Certain communities – low-income neighborhoods and overlooked people – often suffer most because they suffer from health gaps, are more exposed to climate risks, and have a lower ability to prepare, adapt, and recover from their effects.
How vulnerable is your community to climate change?
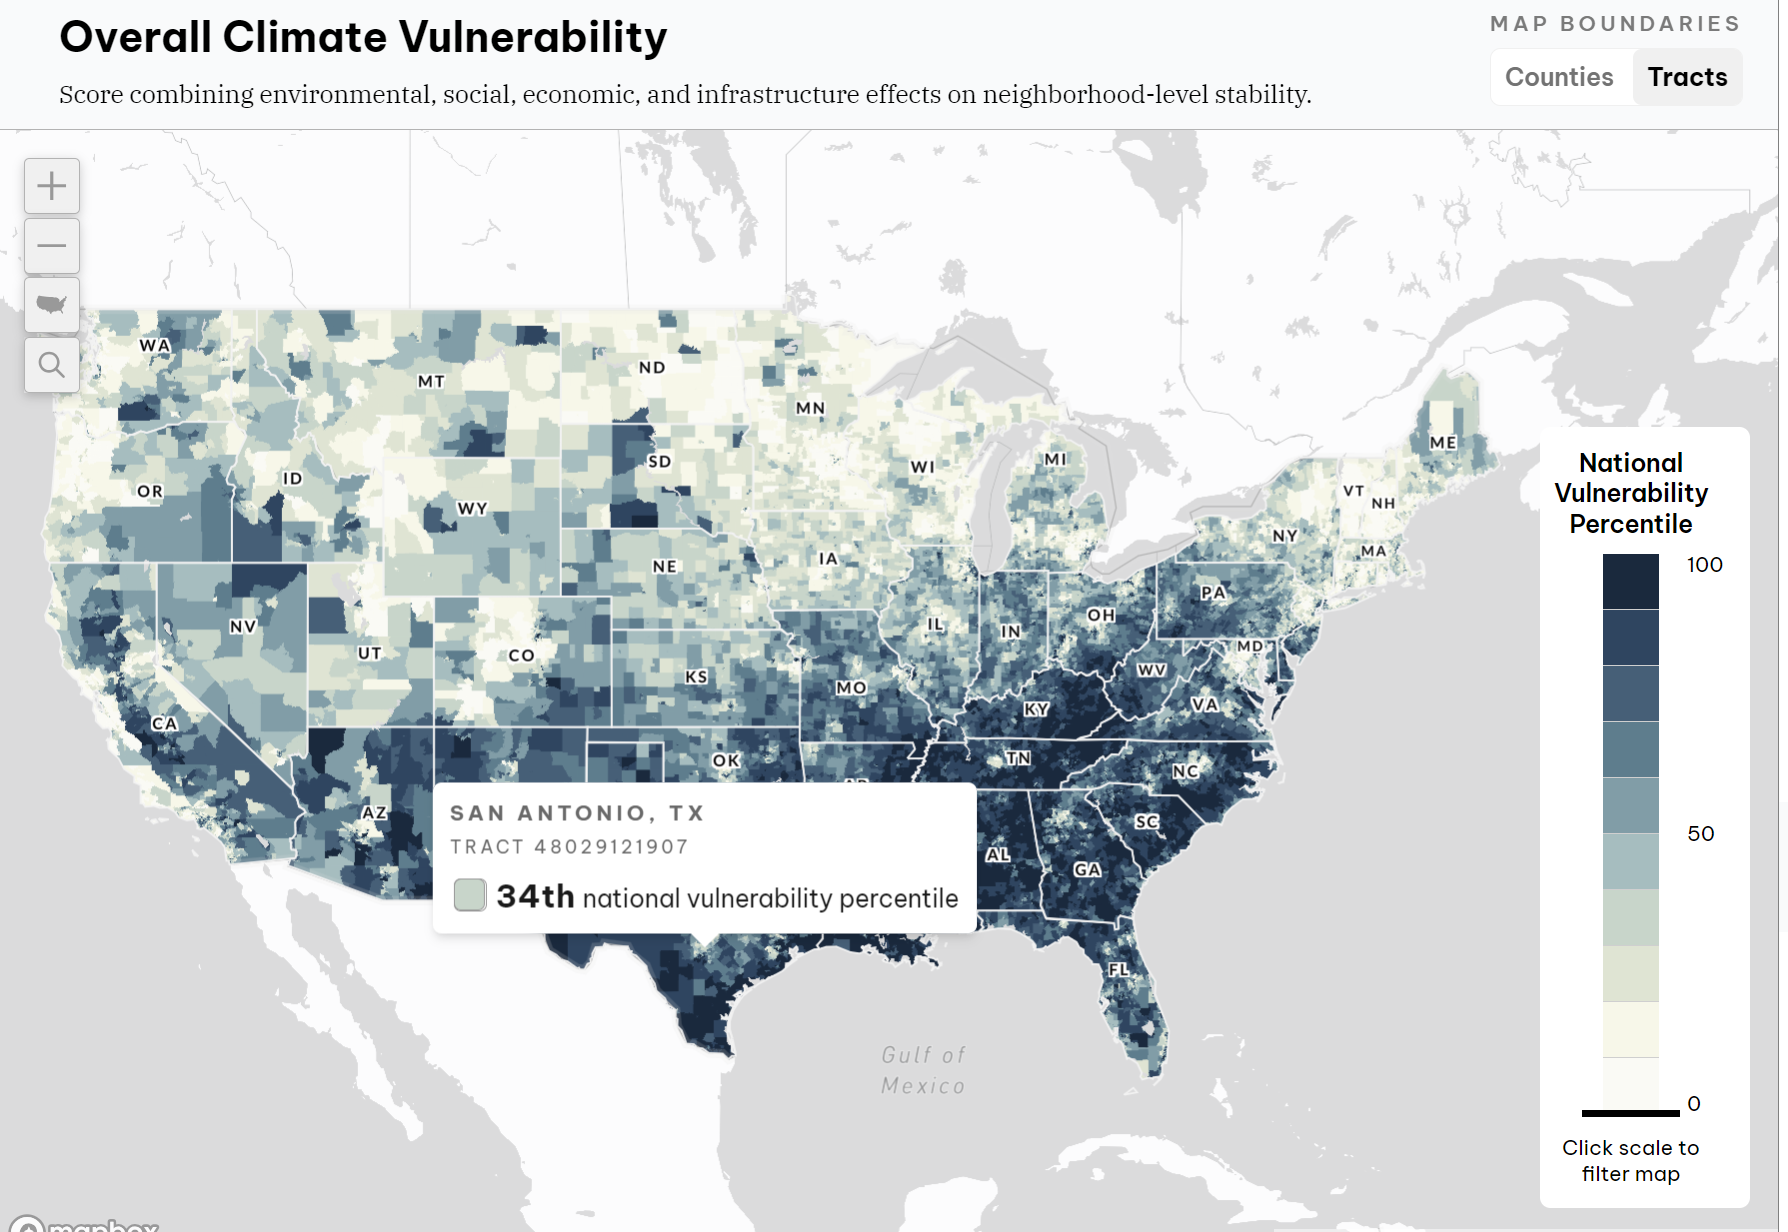
The new U.S. Climate Vulnerability Index (CVI), a mapping tool, uses environmental, social, economic, and infrastructure data to help you understand your community’s ability to respond and adapt to climate change.
“Better understanding of the intersection of vulnerability and climate change risks is key to effectively building resilience because it helps define where climate action and investments are needed most,” according to the CVI website.
Let’s explore this tool and how it can help address climate issues.
How Does the Climate Vulnerability Index (CVI) Work?
The CVI was created by the Environmental Defense Fund, Darkhorse Analytics, Texas A&M University, and Texas A&M Transportation Institute to foster climate justice, which is the fair treatment of all people and the freedom from mistreatment in the creation of policies and projects that address climate change.

The CVI uses data to help visualize climate injustice across the United States.
“Comprising 184 indicators, this mapping tool integrates cumulative impacts that can shape a community – from quality of housing and access to supermarkets to proximity to toxic waste sites,” according to the CVI website.
The CVI map contains a five-level indicator navigation tree that allows users to view and select the indicators that drive vulnerability.
The darker colors represent higher vulnerability.
Users can also take advantage of the Geographic Context Cartogram, which shows how climate risks vary across state or Environmental Protection Agency (EPA) regions.
When users click a location on the map or cartogram, a Location Focus Bar panel will update with details, including the location’s level of vulnerability, national vulnerability percentile score, and rank for the selected indicator.
Get tutorials to help use the CVI or download a webinar kit.
Who Can Use the Climate Vulnerability Index (CVI)?
Anyone can use the CVI.
The tool can help planners, local governments, organizations, researchers, and federal agencies take targeted actions to protect vulnerable communities from climate impacts.
“By identifying areas where investments are most needed, particularly to support underserved communities against climate impacts, the CVI helps ensure resources are channeled to where the greatest benefits can be achieved,” according to the CVI website. “This includes decision-making, policy development, resource allocation, preparedness planning, and community-level environmental action planning and [support].”
The CVI can also help community-based organizations “access to local data that can help them take advantage of grant opportunities for reducing [gaps] in their communities.”
Try the CVI tutorial or watch a video about how to understand and use the CVI for support and grant funding purposes.
Why Is Environmental Justice Important?
Burning fossil fuels like coal, oil, and gas – among other forms of human intervention – contributes to climate change.
“There are many potential health consequences that stem from climate change, including impacting the non-medical drivers of health, such as access to healthy food and safe places to play outside,” according to a Salud America! resource.
With this in mind, it’s common for vulnerable communities to experience the blows of harmful environmental and climatic change.
“Low-income communities, people from vulnerable communities, Native people, people with mental or physical challenges, older or very young people, women – all can be more susceptible to risks posed by climate impacts like raging storms and floods, increasing wildfire, severe heat, poor air quality, access to food and water, and disappearing shorelines,” according to Yale Climate Connections.
Further, climate justice strives to address differences and developed strategies to bring upon ways to successfully eliminate the gaps.
“These issues matter – climate justice matters – because our environment is not just where we live, pray, play, work and learn, it is also who we are, how we are treated and why. People are not affected by these issues [fairly], whether through intent or indifference,” said Dr. Adrienne Hollis to Carbon Brief.
Determining the Health of Your Community
Climate justice impacts the overall health of everyone.
But what about the health of your area?
In addition to the U.S. Climate Vulnerability Index (CVI), check out the Salud America! Health Report Card.
With the report card, you can choose your county and browse Latino-focused and local data with interactive maps and comparative gauges. This can help you visualize and explore local gaps in housing, transit, poverty, health care, food, education, and more.
You can also compare your county to your state and nation.
Share the results with local leaders and organizations to speak up for change and start important conversations about health improvement in your area.
By The Numbers
24
percent
of Mexican American-nonsmokers are exposed to secondhand smoke


