Share On Social!
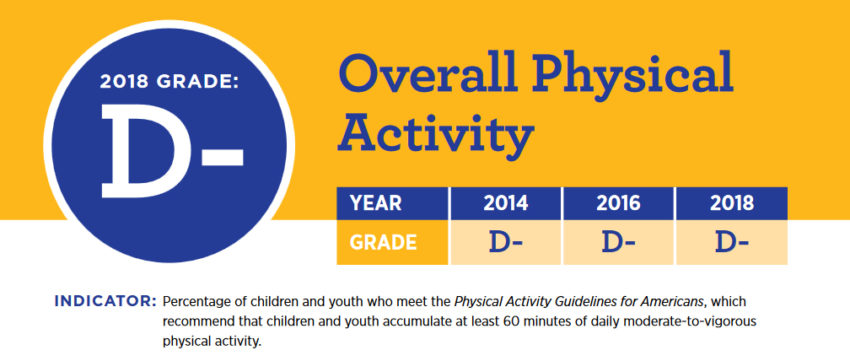
The United States earned a D- in overall physical activity, with only about 24% of kids ages 6-17 getting the recommended 60 minutes of physical activity every day and racial/ethnic disparities persisting, according to the new 2018 U.S. Report Card on Physical Activity for Children and Youth.
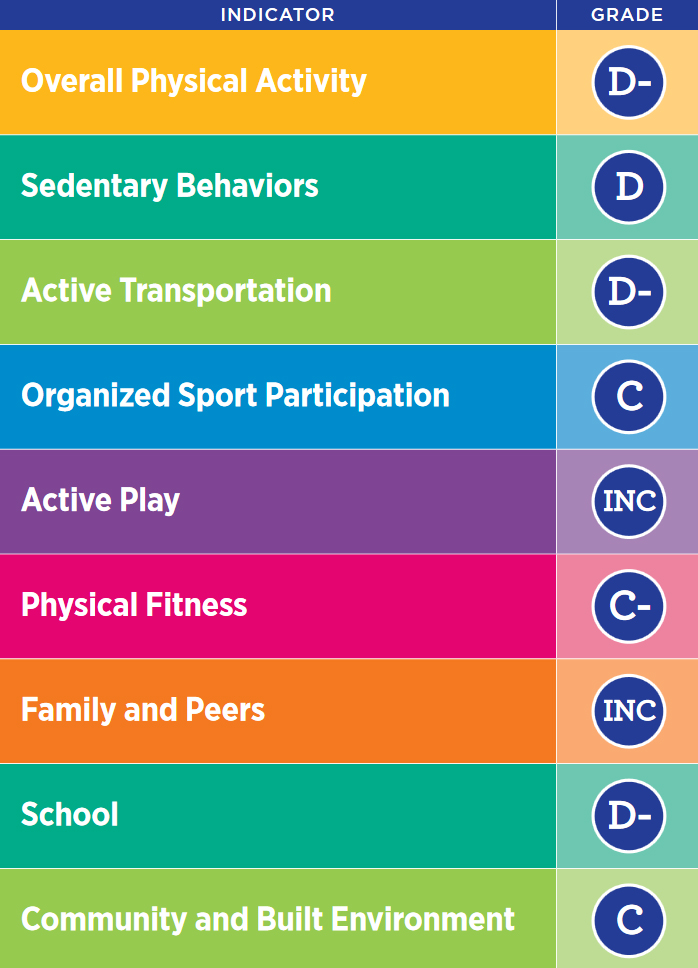
The 2018 Report Card is from the National Physical Activity Plan. It grades how well U.S. is doing these categories: overall physical activity, sedentary behaviors, active transportation, organized sport participation, active play, health-related fitness, family and peers, schools, and community and the built environment.
The grades for each category, while poor, have improved some since 2016.
 Grades improved for sedentary behavior, active transportation, organized sports, and physical fitness.
“While these positive results are encouraging and provide a glimpse into what’s possible, there is no denying that the overall grades for the indicators remain critically low,” said Peter Katzmarzyk, chair of the Report Card Research Advisory Committee, in a news release. “This Report Card should generate a renewed sense of urgency to take the action needed for the sake of our children and their future.”
Why Are the Grades So Bad?
76% of American children and youth are not getting enough daily physical activity.
There are big disparities in the amount of physical activity and related opportunities that U.S. children have based on their gender, age, race/ethnicity, and ability.
Gender. Approximately 35% of high-school boys but only 18% of high-school girls report participating in at least 60 minutes of daily physical activity.
Age. Children ages 6-11 participate in more daily physical activity (88 minutes) compared to adolescents ages 12-15 (33 minutes) and 16-19 (26 minutes).
Race/Ethnicity: Girls in Latino-majority schools engaged in 10 fewer minutes of vigorous activity than those in white majority schools, according to a Salud America! research review.
Ability: Children with mobility limitations may engage in less physical activity than those without limitations. 58% of boys ages 5-11 with long-term mobility limitations met physical activity recommendations compared to 75% of boys without limitations.
Additionally, physical opportunity activities are impacted by where you live:
- Children ages 6-11 living in high-crime neighborhoods participated in less physical activity than those living in low-crime neighborhoods.
- Parks in highly disadvantaged neighborhoods were almost 2 times as likely to have incivilities (e.g., presence of litter, graffiti, homeless persons, etc.) compared to those in neighborhoods with low disadvantage.
- Fewer Latinos (70%) than whites (82.5%) say their neighborhood has safe play spaces for kids.
- Approximately 81 percent of Latino neighborhoods lack recreational facilities, compared with 38 percent of white neighborhoods, regardless of income levels.
Grade: Overall Physical Activity
The indicator for overall physical activity was the percentage of children who met the recommended minimum 60 minutes of daily moderate-to-vigorous physical activity. The 2018 grade remained at a D- as it was in 2014 and 2016, with 21.6% of 6-19-year-olds meeting the guidelines.
Activity levels were highest in 6-11-year-olds, (42.5%) and lowest in 16-19-year-olds, (5.1%).
When asked who participated in 60 minutes of physical activity every day, African American children were the most active followed by White and Hispanic children. However, when asked about participation on at least 4 days per week, White children were the most active. This trend is shown in the graph labeled Panel B.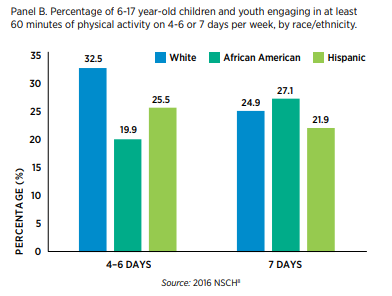
Grade: Sedentary Behaviors
The indicator for sedentary behavior was the percentage of children engaging in 2 hours or less of screen time per day.
The 2018 grade went back to its original 2014 grade of a D, an increase of its 2016 grade of a D-.
- Approximately 35% of white, 32% of Hispanic/Mexican American, 30% of Asian, and 25% of African American children aged 6-19 meet screen time guidelines, with fewer minority children meeting the recommendation than non-Hispanic White children.
- Fewer overweight or obese children meet the recommendation compared to those with a normal weight, which is troubling for Latinos when considering that nearly 40% of U.S. Latino youths ages 2-19 are overweight or obese, compared to 28.5% of non-Latino white youths.
Grade: Active Transportation
The indicator for active transportation was the percentage of children who use active transportation (i.e. walking or biking) to get to and from places.
The 2018 grade increased from an F in 2014 and 2016 to a D-.
- Youth from households with high income reported less active transportation than those from lower income households, which could be due to a lack of a readily available car.
- Among 12-19 year olds, approximately 35% of White, 42% of Hispanic/Mexican-American, 43% of Asian, and 45% of African American youth report walking or biking to get to and from places at least once in a typical week.
Grade: Organized Sport Participation
The indicator for organized sport participation was the percentage of children and youth who participated in organized sport and/or physical activity programs.
The 2018 grade increased from a C- in 2014 and 2016 to a C.
More than half of 6-12-year-olds play in an organized or unorganized team or individual sport, respectively, at least once a year.
Still, 30% of children from low-income households (<$25,000 per year) compared to 12% of children from high-income households (≥$100,000 per year) engage in no sport activity during the year. 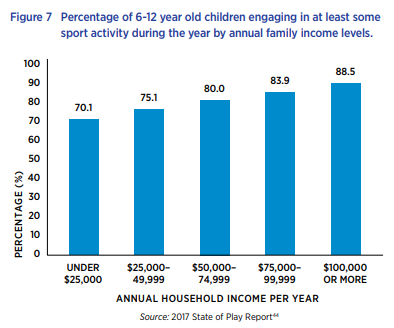
Grace: Active Play / Family and Peers
The indicator for active play were the percentage of children who engage in unstructured active play and report being outdoors for several hours a day.
The indicators for family and peers were the percentage of family members who facilitate physical activity opportunities for, and are physically active with, their children, as well as the percentage of children with peers who encourage them to be physically active.
For these two categories, the 2014, 2016, and 2018 grades were all INC or “Incomplete,” as there is currently no nationally representative data that reflects the information required in the indicator.
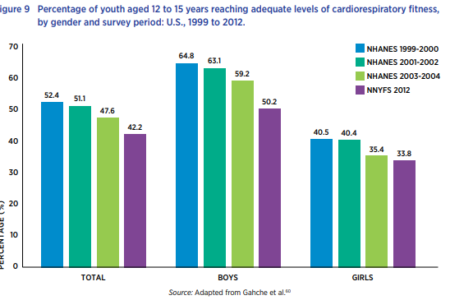
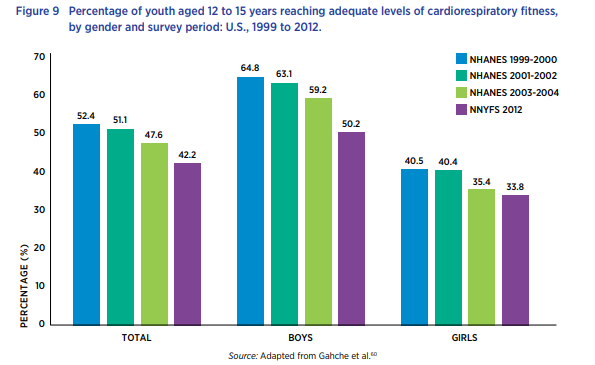
Grade: Physical Fitness
The indicators from physical fitness were the percentage of children who met cardiorespiratory fitness, muscular strength, and muscular endurance standards.
While the 2014 grade was INC, the 2018 grade improved from the 2016 grade of a D to a C-.
- Approximately 42% of 12-15-year-olds have adequate cardiorespiratory fitness levels.
- Approximately 52% of 6-15-year-olds have adequate muscular endurance.
- Approximately 5.3% of boys and 12.1% of girls ages 15-19 are in the “excellent” Health Benefit Zone for grip strength.
Grade: School
The indicators for school focused on the policies and resources currently in place in schools that promote physical activity among children.
The report card shows this grade has been on a steady decline, starting at a C- in 2014, a D+ in 2016, and reaching a low of a D- in 2018.
- Approximately 33% of school districts support or promote walking or biking to and from school.
- Approximately 30% of high school-aged students attend PE classes 5 days a week, and 52% attended PE classes 1 day a week.
- The percentage of schools requiring a PE course be taught in each grade decreases from 97% in 6th grade to 42% in 12th grade.
Grade: Community and Built Environment
The indicators for community and built environment focused on infrastructure, community facilities and programs, safe neighborhoods, and facility and park maintenance.
The 2018 grade decreased from a B- in 2014 and 2016, to a C.
- Approximately 64% of kids ages 6-17 live in a safe environment; however there are disparities: 72% of White children, 53% of African American children and 54% of Hispanic children live in safe environments
- Conditions vary: 62% of parks have little to no litter present and 89% of parks have no graffiti
- Park use was significantly lower in low- vs. high-income communities.
How to Make a Change
These findings will only improve with a call for positive change. Here are a few ways you can get involved and make an improvement within your community:
- Get involved with a Student Health Advisory Council (SHAC) in your area to work on improving the health of children attending your school district.
- Encourage your child’s school to implement “brain breaks” where students take a break from learning to exercise like this school in Kyle, Texas did.
- Encourage your child’s school to implement a walking program like this Chicago community did.
Explore More:
Green & Active SpacesBy The Numbers
33
percent
of Latinos live within walking distance (<1 mile) of a park