Share On Social!
Some areas of San Antonio (68% Latino) are much harder to live in than others.
Latinos in these areas face more hardship, health problems, and die sooner. In fact, everyone living in these areas faces more hardship, health problems, and dies sooner.
Lily Casura and other grad students in Social Work at the College of Public Policy at UT San Antonio (UTSA) mapped ZIP-code level data and launched a project to explore life lived in four difficult-to-live ZIP Codes in San Antonio.
Their goal is to deepen conversations about equity and investment to improve quality of life.
January 2019 UPDATE: Casura continues to gift San Antonio with interactive maps, to include results of the 2018 Community Needs Assessment.
Why ZIP Codes?
Everyone can visualize the physical environment of their ZIP code and the relationship they have with it. Many often do the same with neighboring ZIP codes.
These are the geographical areas where we live, learn, work, and play. They are made up of homes, schools, childcare, parks, grocery stores, pools, businesses, workplaces, healthcare, and community services, as well as the streets and overall transportation network that connect people to these places.
Policies throughout the 1900s, including segregation in housing, schools, and workplaces, guided the design of and investment in the physical world of our ZIP Codes and cities.
This is important because the physical world of our ZIP Code impacts our educational attainment, income, and physical and mental health.
Inequity in the quality and availability of schools, affordable childcare, healthy food, parks, healthcare, employment opportunities, and safe routes to get us there leads to disparities in health.
In fact, our ZIP Code is a bigger predictor of our health and life expectancy than our biology.
Inequity in San Antonio has resulted in drastic health disparities. Diabetes rates are as high as 20% in some parts of the city and life expectancy varies by 20 years in different ZIP Codes.
Grad Student Maps Data
Lily Casura, a graduate student, wanted to determine if poverty was distributed equally across the city or if it existed in pockets.
Through an internship with the City of San Antonio Human Services, she turned to the Census Bureau for ZIP Code-level data.
The first three things they looked at were percent below poverty level, educational attainment, and median household income.
“I quickly saw, when we sorted [the data], it was the same ZIP Codes out of more than sixty in each of those categories,” Casura said.
Casura mapped the data, using Tableau, and found a “crescent of comfort” to the north and concentrated disadvantaged below.
Casura refers to areas with concentrated disadvantage as the highest-hardship areas. Hardship is a combination of poverty, income, employment, education, living conditions and population dependency (under 18 or over 64 years of age), according to the Brookings Institute.
Think of this an indicator of difficult living.
So difficult, that one in four residents in ZIP Code 78207 don’t finish ninth grade.
Casura spent over 800 hours sorting and mapping the data and found that four ZIP Codes repeatedly appeared at the bottom of the list: 78207, 78237, 78202 and 78203.
“Clearly, there is something to this “geography of poverty” concept — and my hope is that by examining it more deeply through the hardship index, we can start a conversation about overlapping, concentrated disadvantage that can broaden the meaning of the “equity lens” for San Antonio,” Casura wrote in the Huffington Post.
Even if she stopped here, the interactive map is an incredible gift to San Antonio.
But she didn’t stop there.
Website and Panel
Casura partnered with other social work graduate students to come up with a project to take a closer look at the four ZIP codes.
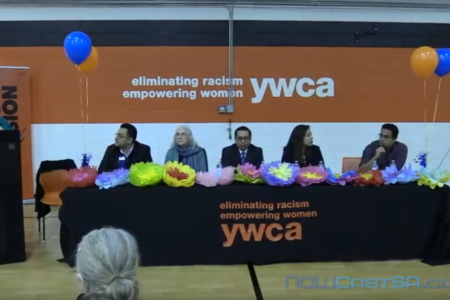
Source: Screenshot from NowCastSA
“We just thought it was really important to bring this information out there and then assemble a really awesome panel of experts who all have a lived experience and a lot of wisdom and knowledge to talk about how we got here, where we are right now, and what the way forward looks like,” Casura said.
The students started a website about their project, called “Not on MY Map,” organized a panel discussion with local leaders to discuss the historical context of the four highest-hardship ZIP Codes, and created a Facebook event to spread the word.
They invited the following local leaders to be panelists: Richard Montez, Director of Members Services for the Hispanic Association of Colleges and University; Patti Radle, co-director of Inner City Development and previous city council member; Rep. Diego Bernal, Texas State Representative for House District 123; Queta Rodriguez, Veterans Service Officer for Bexar County and retired marine; and Matthew Martinez, Ph.D., research analyst at Rice University.
One Hundred people attended the “It’s Not on MY Map” event in November 2017.
Casura began the event with a presentation of their findings, using the maps and graphs created in Tableau to contrast the “crescent of comfort” with the areas of concentrated disadvantage. She used the maps to illustrate how segregation and inequality are linked to health disparities and low income mobility.
Then, the panelists introduced themselves and explained why the topic of vulnerable ZIP Codes interests them.
“I’m interested because I lived it,” Rodriguez said. “I’m not an expert and I’m not in academia, but I have the life experience.”
They discussed numerous issues, such as inequity in school finance, dropout legacy neighborhoods, cultural factors, job training, and poverty, and opened the floor to input and questions from the audience.
Poverty is particularly problematic in San Antonio, not only because it is concentrated, but because of the way public schools are financed in Texas.
The way Texas funds its public schools in inequitable because it’s based on property taxes, Bernal said. This means that school districts in impoverished areas receive less money per student that school districts in wealthier areas. When you look at money per student and student achievement, you will see that it tracks perfectly with poverty, Bernal said.
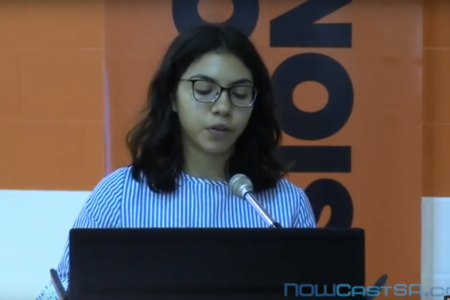
Source: screenshot from NowCastSA
A high school senior spoke about how the design of physical structures and the environment, like classrooms, playgrounds, parks and gymnasiums can help or hinder one’s ability to reach their potential.
“My elementary school was run-down, everything in the classroom was falling apart, and houses were falling apart,” she said. “It’s hard to have dignity and it’s hard to have pride, if that’s all we see.”
Contact your Elected Representative
When asked how people in San Antonio can do more, the panelists discussed the importance of voting and speaking up.
Electing people who agree with you isn’t enough if they don’t do anything about it, Bernal said.
Elected officials are supposed to respond to the concerns and questions of the people they represent, whether in person, over the phone, or by email.
“When people ask me what they can do, I tell them to go to their representatives to explain what issues they care about, and ask them two things, ‘what are you going to do about it and what have you done,’” Bernal said.
It is important for everyone to speak up, and data can help build your case.
Casura’s work has made it much easier for San Antonio residents to build their case for policy, systems and environmental change, particularly in ZIP Codes of concentrated disadvantage.
You can watch the event here courtesy of NowCastSA, a nonpartisan, nonprofit online news organization.
Whether you live in San Antonio or not, here are three ways to find some of the elected officials who represent you:
- Who Represents Me will provide your U.S. Senators and Representative, State Senators and Representative, and State Board of Education Member
- Google search “city officials in [your city, state]” and go to your city’s official website to find your mayor and city council members.
- Google search “county officials in [your county state]” and go to your county’s official website to find your chairman/judge and commissioners.
- Google search “boards and commissions in [your city, state]” and apply for the ones you are interested in.
| Table 1. Percent population Hispanic, percent below poverty level, percent with high school diploma, median household income, and percent with less than a ninth grade education by ZIP Code. | ||||||
| Report Area | Total Population | Percent Population Hispanic or Latino | Percent Below Poverty Level | Percent with High School Diploma | Median Household Income | Percent with Less than a Ninth Grade Education |
| San Antonio | 1,492,510 | 63.8% | 19.5% | 81.6% | $48,183 | 9.2% |
| 78207* | 55,514 | 94% | 40.7% | 52.7% | $23,744 | 26.80% |
| 78237* | 36,929 | 95% | 34.1% | 53.2% | $26,426 | 24.70% |
| 78202* | 11,691 | 63% | 48.3% | 63% | $22,506 | 16.8% |
| 78203* | 6,099 | 68% | 36.5% | 65.2% | $27,348 | 19.5% |
| *Data was assembled by Lily Casura | ||||||
January 2019 UPDATE: Casura mapped results of the 2018 Community Needs Assessment. As part of the Community Services Block Grant, agencies must conduct community needs assessments (CNA) every three years. This is the first time San Antonio can view results on an interactive map. Moreover, this is the first San Antonio can view results of partner agency surveys on interactive charts.
By The Numbers
23.7
percent
of Latino children are living in poverty