Share On Social!
Walkable urban places correlate with economic, social equity, and environmental benefits, according to a new report.
The new report, Foot Traffic Ahead 2019, ranks the amount and characteristics of walkable urban places in the 30 largest U.S. metropolitan areas.
Unfortunately, just 0.04-1.2% of land in these cities counts as walkable urban places.
The new report explores the reasons for this deficiency and outlines how cities can stimulate more walkable urbanism and its many benefits.
“U.S. metros where the public and private sectors work together to adapt and deliver increased supply of walkable urban places will be the economic and social justice winners of the next generation,” according to the Foot Traffic Ahead report, released in June 2019 by Smart Growth America/LOCUS and the Center for Real Estate and Urban Analysis (CREUA) at the George Washington University School.
Areas with the Most, and Least, Walkable Urban Places
Foot Traffic Ahead ranks the 30 largest U.S. metropolitan areas based on the percentage of office, retail, and rental multi-family space each has in their walkable urban places (WalkUPs).
WalkUPs can be downtowns or suburban towns with more than 1.4 million square feet of office space and/or more than 340,000 square feet of retail space with a Walk Score® of 70 or greater.
The top six of the 30 metropolitan areas account for 49% of all WalkUPs:
- New York City (29.1% Latino)
- Denver (30.5% Latino)
- Boston (19.4% Latino)
- Washington, D.C. (10.7%)
- San Francisco Bay Area (15.3% Latino)
- Chicago (29% Latino)
The bottom seven of the 30 metropolitan areas account for just 8% of all WalkUPs:
- Miami (72.2% Latino)
- San Diego (30% Latino)
- Tampa (25.1% Latino)
- Orlando (51% Latino)
- San Antonio (64% Latino)
- Phoenix (42.5% Latino)
- Las Vegas (32.7% Latino)
“These metros demonstrate that focusing on sprawling, drivable sub-urban development patterns reduce economic performance and social equity outcomes,” the report states.
One important note: The bottom seven cities have greater Latino populations than those in the top six. Worse, this group also faces disparities in access to transportation and housing.
How WalkUPs Promote the Economy
WalkUPs are economically outpacing driveable suburban areas.

Since 2010, driveable urban real estate developments have been losing market share to walkable urban real estate developments.
Rent premiums for retail, rental multi-family spaces in walkable urban areas have higher rent per square foot premiums over driveable sub-urban space.
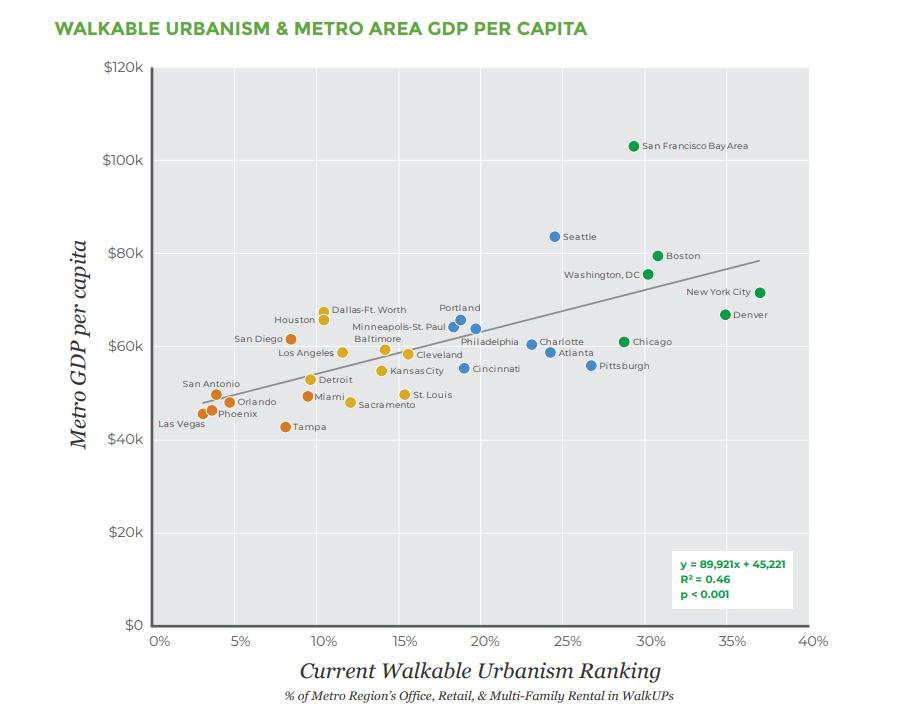
There is a 52% gross domestic product (GDP) per capita “premium” for the top six most walkable urban metros over the bottom six. This is comparable to the GDP per capita premium between Germany, the leading major economy in the European Union, and Spain or Italy, middle-income major economies.
Unfortunately, economic success often suggests higher housing costs, which has social equity implications.
Higher housing costs in addition to a disconnect between supply and demand of housing in walkable urban areas entrenches the wealthy while pricing out Latinos and low-income families.
How WalkUPs Promote Social Equity
Foot Traffic Ahead also created a Social Equity Index that examined the rental/for-sale housing mix and housing and transportation costs for households earning 80% of area median income (AMI).
On average, homes in WalkUPs are worth almost twice the median home sell price.
The average for-sale per square foot premium is 90%, ranging from 17% in Baltimore (5% Latino) to 223% in Boston. The average rental premium was 46%, ranging from 27% in Denver to 88% in Detroit (7.6% Latino).
Higher premiums exclude lower-income households while displacing existing residents.
The national average for all household spending on housing is 27%, compared to 37% in WalkUPs, which ranges from 21.8% in Las Vegas to 47.4% in Orlando. Transportation costs in WalkUPs range from 8.9% in New York to 21.3% in San Antonio.
Housing and transportation trends have pushed Latinos farther from transit hubs and amenities, where housing is more affordable and transportation is more expensive and burdensome, according to a Salud America! Research Review.
This reduces Latinos’ opportunities to build health and wealth.
“By shifting household income from ownership and maintenance of automobiles (always depreciable assets) to housing (generally an appreciative asset), there is a far better opportunity to build household wealth,” the report states.
The Potential Future Growth for WalkUPs
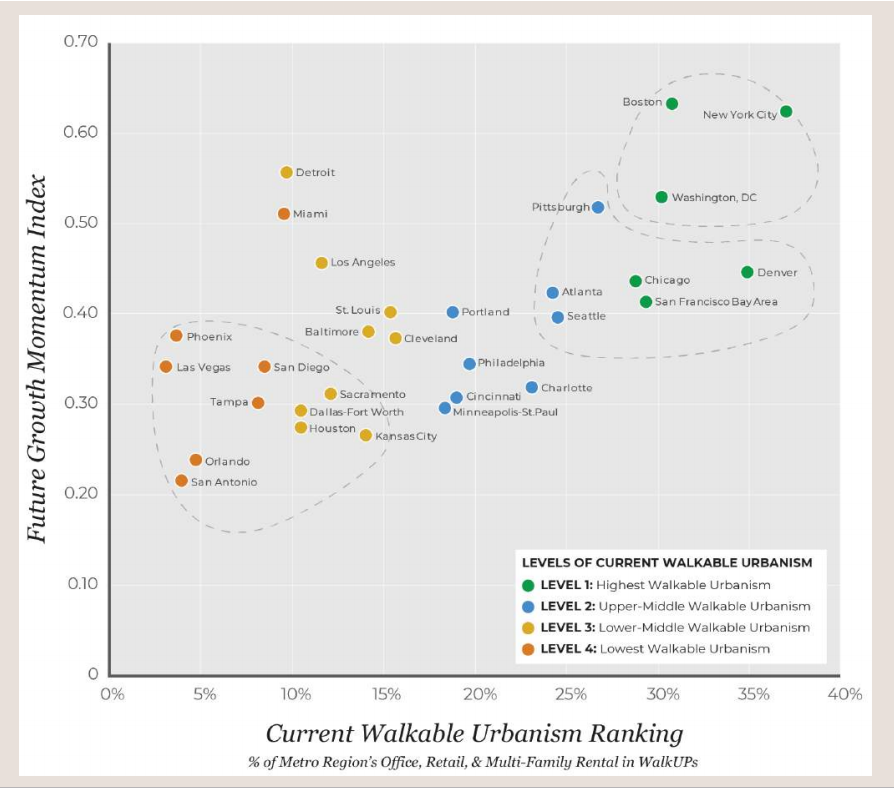
Foot Traffic Ahead also ranked the metro areas on the probable future of their walkable urban development by looking at the Market Share Shift Index, rent premiums, absorption, and the urbanization of suburbs.

Detroit, Pittsburgh (2.9% Latino), and Miami replaced Denver, Chicago, and San Francisco Bay Area among top six metro areas for high future growth momentum for walkable urbanism.
Dallas-Fort Worth (41.7% Latino), Houston (44.5% Latino), Kansas City (29.6% Latino), Orlando, and San Antonio ranked among the bottom five metro areas with low future growth momentum for Future Walkable Urbanism.
“These low-ranking metros have also demonstrated an inability to change by continuing to promote driveable sub-urban development patterns in public policy and infrastructure investments, such as voting against transit investment or maintaining outdated zoning codes that mandate a certain type of development less preferred by today’s market,” the report states.
For the first time in 70 years, U.S. metropolitan growth is shifting away from driveable sub-urban development towards walking urban development.
How to Generate More WalkUPs in Urban Areas
Density and transit access are ways to generate more walkable growth to address equity challenges.
However, single-family zoning is the primary driver of sprawl, thus the enemy of both.
Single-family zoning, a form of exclusionary zoning, is rooted in a legacy of discriminatory policies and practices, similar to redlining, which cemented racial and economic segregation in many cities.
That’s why in December 2018, Minneapolis passed a new policy to end single-family zoning. California and Oregon are considering similar policies in the face of both affordable housing crisis and environmental concerns.

Detached single-family homes are often the least profitable development. Unless it’s illegal to build anything else.
“Single-family zoning means that everything else is banned,” said Scott Wiener, a California state senator, speaking this spring at the Brookings Institution in Washington according to the New York Times. “Apartment buildings — banned. Senior housing — banned. Low-income housing, which is only multi-unit — banned. Student housing — banned.”
In the following cities, it is illegal to build anything other than detached single-family homes on three-fourths or more of residential land: Los Angeles (75%), Portland, Ore. (77%), Charlotte, N.C. (84%), Sandy Springs, Ga. (85%), Arlington, Tex. (89%).
This subsidy of single-family homes limits land for new, affordable housing while calling for more roadways.
“It allows people to own homes they could not afford if the same land could be used for an apartment building,” wrote the New York Times Editorial Board.
“It’s a huge entitlement program for the benefit of the most entitled residents.”
Too much land—and subsequent resources—have being dedicated to single-family zoning, but changes parcel by parcel would be inefficient in most cities.
A single, sweeping edit to these maps may be politically easier than block-by-block tweaking, said Salim Furth, an economist at the conservative Mercautus Center, according to the New York Times.
“Unmet demand for affordable pedestrian and transit-accessible multi-family apartments in the suburbs is a major equity challenge, particularly since it is illegal to build apartments in many suburban WalkUPs,” the report states.
Share this report with leaders in your community and build the case for the equity and economic benefits of walkable urbanism.
Go here to find other ways to improve transit and housing access among Latinos!
By The Numbers
27
percent
of Latinos rely on public transit (compared to 14% of whites).


