Share On Social!
Although driving declined in 2020, U.S. pedestrian deaths increased, especially among Latinos and other people of color, according to the new Dangerous by Design report from Smart Growth America and the National Complete Streets Coalition.
Pedestrian deaths have risen each year since 2009 – up 62% overall since then.
Why?
Roads in America are designed and funded primarily to quickly move people driving. Also, vehicles have been getting larger and more powerful.
But speed comes at the expense of safety.
Although transportation planners, engineers, and agencies claim to seek simultaneous goals of speed and safety, these two goals are incompatible, signified by the rising trend in pedestrian deaths.
“States must use the enormous freedom and flexibility of federal highway funds to prioritize safety,” the report states. “The flexibility given to states means the responsibility for safety improvements and the accountability for the safety performance of their transportation system falls to them.”
How Dangerous Are American Roads for People Walking?
Pedestrian deaths increased 4.5% from 2019 to 2020, according to Dangerous by Design.
All traffic fatalities increased 6.8% from 2019 to 2020.
Not only have American roads been getting more deadly, but the decrease in driving during the pandemic actually made it worse.
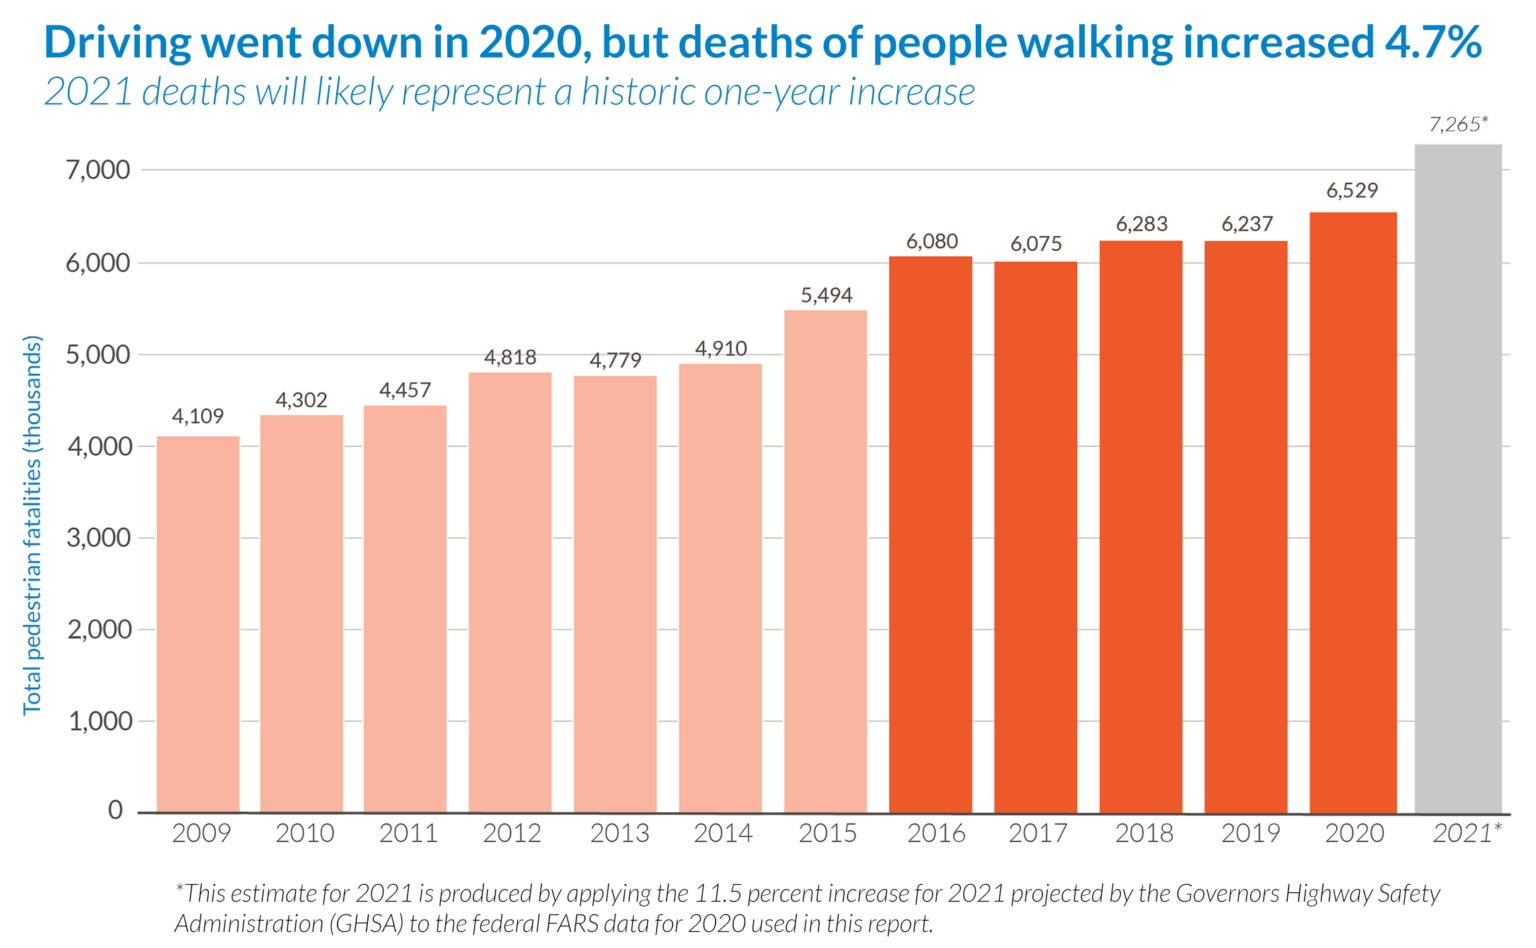
The traffic fatality rate increased drastically when considering the drop in miles driven.
“Our traffic deaths per mile driven increased by 21 percent [in 2020] compared to the 2019 rate, reaching the highest death rate per mile driven since 2007,” the report states.
The rise in pedestrian deaths is unique to America.
Most peer nations have seen declines in pedestrian deaths, especially amid COVID-19.
“Although driving went down almost everywhere around the world during the pandemic, the US was one of the only countries in the developed world that saw an increase in the deaths of people walking when that dip in driving occurred,” the report states.
How Dangerous Are American Roads for People of Color Walking?
Everyone is affected by dangerous street design in some way.
But this burden is not shared equitably, as the pandemic perpetuated existing disparities in which pedestrians are being killed at the highest rates.
Latinos (1.8 pedestrian deaths), Blacks (3.0 deaths), and American Indians or Alaska Natives (4.8 deaths) had higher pedestrian death rates than Whites per 100,000 population (1.5 deaths) from 2016-2020, according to Dangerous by Design.
“People of color are overrepresented in the percentage of pedestrian deaths,” the report states.
However, the full extent of disparities is unknown due to lacking data.
What Are the Most Dangerous Places to Walk in the U.S. in the Last 10 Years?
Eighty-one of the 100 metro areas analyzed got more dangerous over the past decade.
All 20 of the most deadly metro areas have grown more deadly over the last decade, according to Dangerous by Design.
Most of these are in the South with large Latino populations.
For example, seven of the top 20 most dangerous metros are in Florida, four are in California, three are in South Carolina, and two are in Texas.
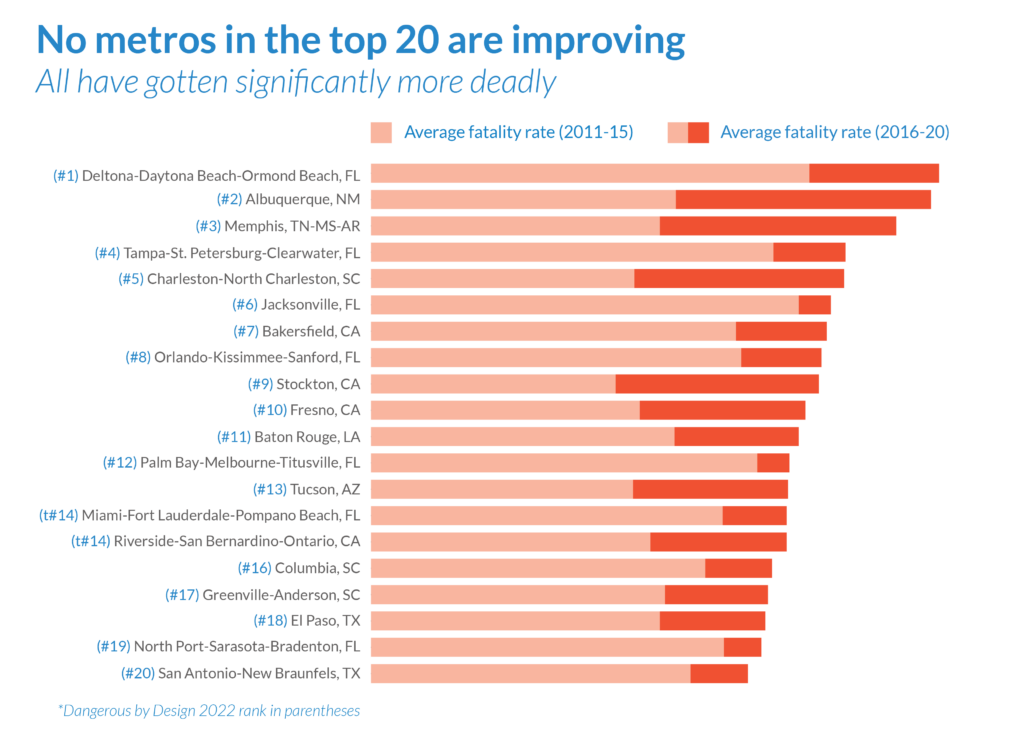
Over the last decade, these are the metros that got more deadly:
- Albuquerque (49% Latino)
- Memphis (6% Latino)
- Charleston-North Charleston (6% Latino)
- Stockton (42% Latino)
- Fresno (53% Latino)
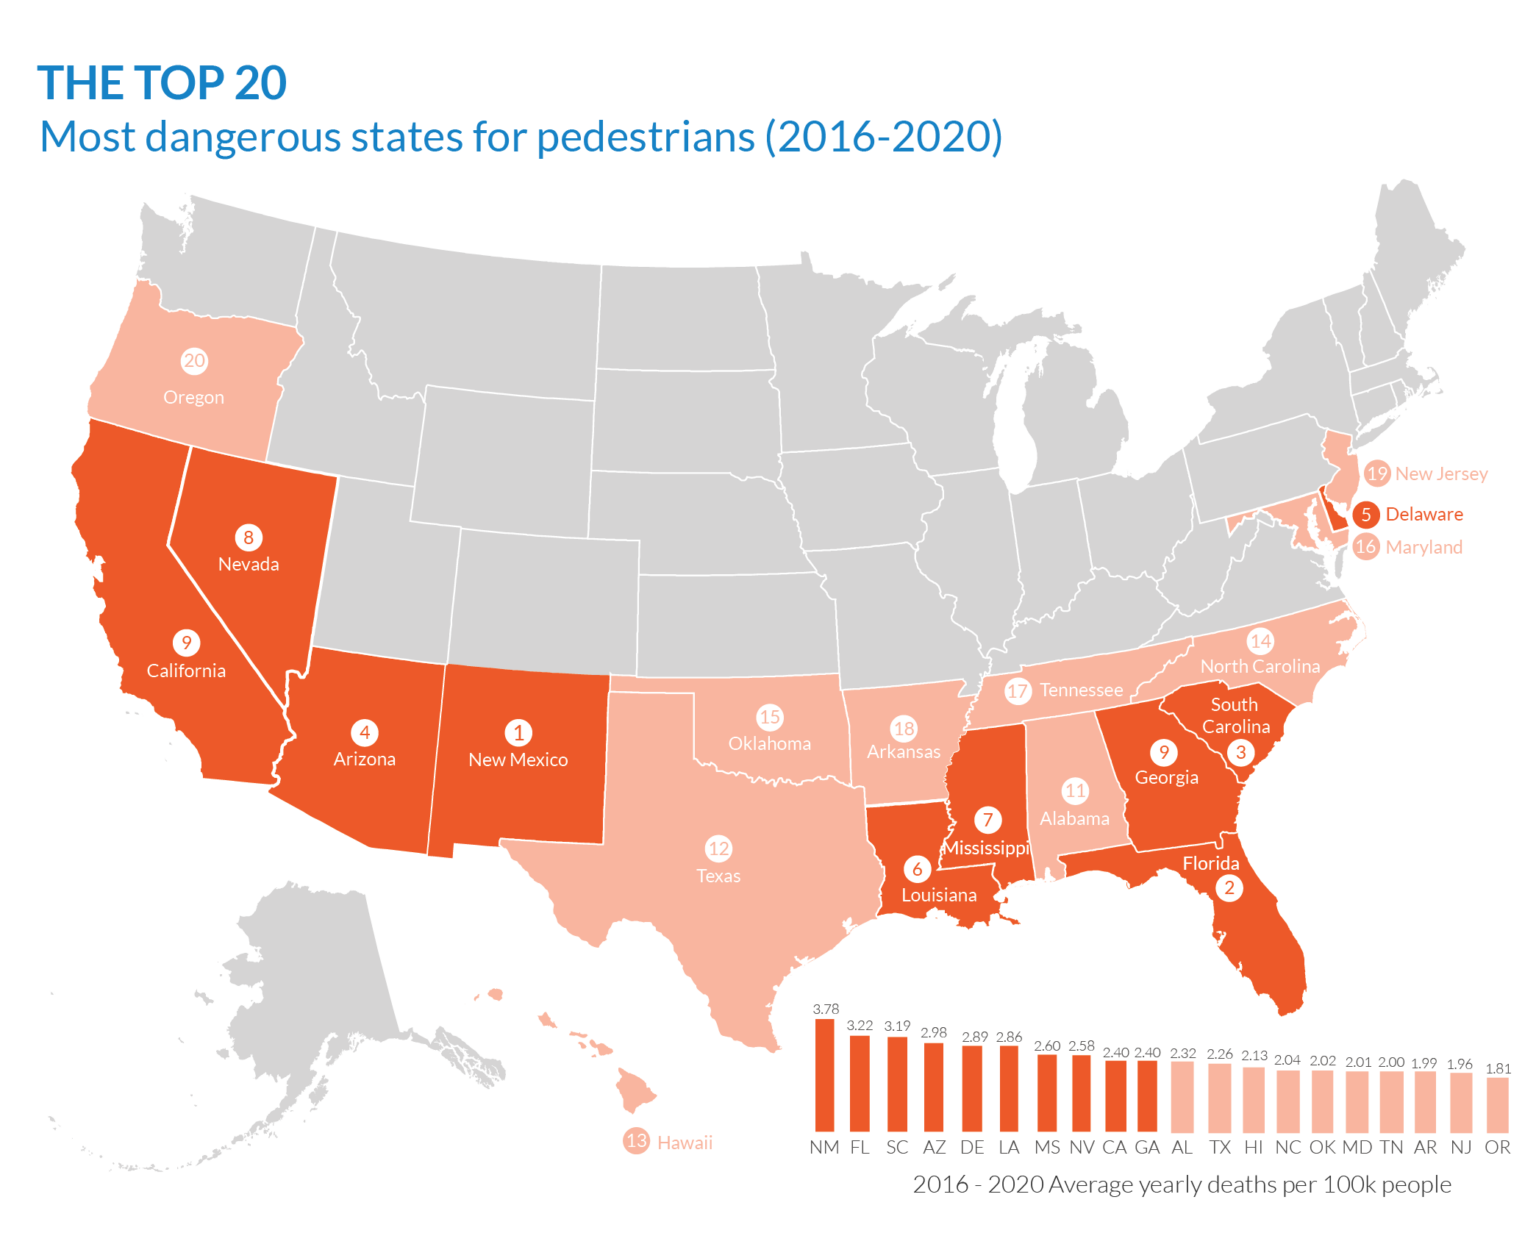
All 20 of the most deadly states have grown more deadly over the last decade. including:
- New Mexico (49% Latino)
- Florida (26% Latino)
- South Carolina (6% Latino)
- Arizona (32% Latino)
- Delaware (9% Latino).
Only Montana (4% Latino), North Dakota (4% Latino), New York (19% Latino), Massachusetts (12% Latino), and Washington, D.C. (11% Latino) lowered their fatality rates over the decade.
The new report includes an interactive map that plots every pedestrian fatality with location data from 2008-2020.
What Are the Most Dangerous Places to Walk in the U.S. During the COVID-19 Pandemic?
Sixty-seven of the 100 metro analyzed got more dangerous during the pandemic, according to Dangerous by Design.
Many of top 10 metro areas that got more deadly during the pandemic have large populations of color. The top five include, Little Rock-North Little Rock-Conway, AR (28% Black and Latino); Memphis (53% Black and Latino); Baton Rouge (39% Black and Latino); Charleston-North Charleston (31% Black and Latino); Jackson, MS (52% Black and Latino).
Eighty-two states got more dangerous during the pandemic.
Many of the states that got more dangerous during the pandemic compared to the previous four years have large populations of color. These include, in order, Mississippi (41% Black and Latino), Arkansas (23% Black and Latino), Tennessee (23% Black and Latino), South Dakota (6% Black and Latino), and South Carolina (32% Black and Latino).
It is important to note that this year’s rankings are not directly comparable to other years due to modifications in the evaluation methods.
Different from previous editions, the 2022 edition of Dangerous by Design ranks 50 states and the nation’s largest 100 metropolitan areas based on deaths per 100,000 residents over a five-year time frame. Previous editions used an equation that took into account walking rates in addition to pedestrian deaths per population over a ten-year time frame.
These modifications were made in response to how COVID-19 changed commuting and travel patterns and shortcomings in U.S. Census data on walking. U.S. Census data on walking only considers commute trips, which are walking trips to work. U.S. Census data on walking overlooks all other walking trips, such as trips to school, the grocery store, restaurants, and other destinations.
Thus, to analyze the pandemic’s influence on walking and deaths, Smart Growth America and the National Complete Streets Association relied on StreetLight data for walking data, which relies on information from cellphones and mobile devices.
How Did the Pandemic Impact Walking and Walking Deaths?
Walking increased everywhere during the pandemic.
However, more walking only made certain metro areas more deadly during the pandemic—the metro areas that were already more deadly.
For example, while the most deadly metro areas saw a 49.8% increase in walking and a 15.3% increase in deaths, the least deadly metro areas saw a 45.0% increase in walking and 1.4% decline in deaths.
Moreover, fatality rates increased the most on average in the metro areas that had lower shares of people walking to work before the pandemic, and fatality rates decreased (or increased the least) on average in the metro areas that had higher shares of people walking to work before the pandemic, according to Dangerous by Design.
“A sudden increase in walking coupled with fewer cars on the road in these places likely contributed to a perfect storm of conditions and an increase in deaths,” the report states.
Ultimately, seeing a rise in deaths on American roads during a drop in driving disproves claims that traffic deaths are linked to the amount of driving and have an element of randomness.
Crashes, particularly deadly crashes, are not random.
Rather, deadly crashes are linked to road design.
What Does “Dangerous by Design” Mean?
Roadway design often has more influence on driver behavior than the posted speed limit.
This is a problem because the high-speed highway design between towns and cities was applied to roads in towns and cities.
Sixty percent of all pedestrian deaths in 2020 occurred on non-interstate arterial highways located in urban areas. These roads are often controlled by the state’s Department of Transportation rather than the municipality.
When roads are wide and straight with infrequent intersections and rounded sweeping corners at those intersections, people feel comfortable driving faster.
This works on interstates, but not on city streets.
These roads send drivers two conflicting messages with low posted limits but designs that encourage higher speeds.
In the end, regardless of the posted speed limit, wider roads and turning radii lead to higher speeds, and higher speeds narrow a driver’s field of vision.
Thus, despite wide travel lanes, a narrowed field of vision resulting from higher speeds makes conflict harder to anticipate and avoid.
Due to higher speeds, the crashes that do occur are more severe and more likely to result in death or serious injury. Many city roads are dangerous by design, and no amount of additional walking or enforcement can overcome a roadway design that is fundamentally dangerous.
“If you need a sign to tell people to slow down, you designed the street wrong,” explains transportation engineer Charles Marohn.
Check out this video from Smart Growth America and the National Complete Streets Coalition explaining why safety and speed are incompatible goals.
Why Are People of Color Overly Burdened by Dangerous Road Design?
Roads that are dangerously designed are particularly problematic in U.S. Southern cities.
“The bulk of the growth and development in these [Southern] regions has taken place in an era (post-1960) where low-density sprawling land uses and high-speed, multi-lane arterial highways have been the dominant form, with historic amounts of state and federal transportation funding poured into street designs that are deadly for everyone, especially people walking,” Dangerous by Design states.
It’s also worse in neighborhoods of color and low-income neighborhoods.
“The existence of dangerous, auto-centric infrastructure in communities of color is a result of ‘urban renewal’ projects like the construction of the interstate system, which was intentionally sited through many Black and Brown communities, displacing millions of people and causing catastrophic damage for decades to those left behind, like increased exposure to pollution, worse access to jobs and services, and devastated local economies,” the report states. “Black and Brown neighborhoods also tend to have more high-speed roads, poor visibility, and heavy traffic volume, and a lack of facilities for people walking.”
As mentioned previously, transportation planners have designed roads in America primarily to move people in cars quickly at the expense of keeping all people safe.
Similarly, intentionally or not, transportation planners have designed roads in America primarily to move people through low-income neighborhoods and neighborhoods of color at the expense of the people living in those neighborhoods.
“Lower-income neighborhoods are also much more likely to contain major arterial roads built for high speeds and higher traffic volumes at intersections, exacerbating dangerous conditions for people walking,” the report states.
How Does Pedestrian Death Data Lack Racial/Ethnic Information?
One problem is that pedestrian death data often lacks racial/ethnic data.
Nationwide, 11% of all pedestrian fatalities examined for Dangerous by Design failed to report race or ethnicity. It’s worse in some places.
For example, 29% of California pedestrian deaths, 39% of New York’s pedestrian deaths, and 39% of Pennsylvania’s pedestrian deaths in 2020 lacked race or ethnicity data, according to the report.
This means disparities could be even worse.
Could Traffic Congestion be a Protective Factor for Pedestrians?
Some experts now believe traffic congestion is a protective factor against traffic deaths because it slows drivers.
Although hundreds of billions of dollars have gone into congestion mitigation in recent decades, congestion has generally remained the same.
This means, despite massive roadway expansion projects, people are going roughly the same speed and spending the roughly the same amount of time driving.
In fact, both freeway capacity and congestion have grown faster than population.
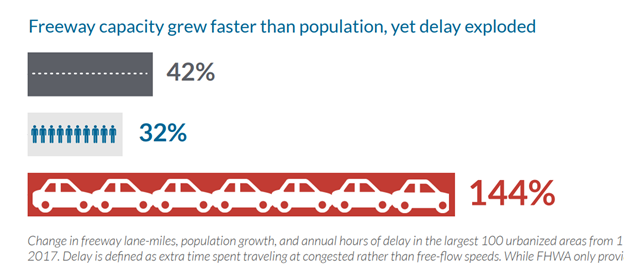
Despite spending billions to expand freeways by 42% between 1993 and 2017, congestion grew 144% during this time while the population grew 32%, according to The Congestion Con from Transportation For America.
That was until the pandemic, where drops in driving resulted in less congestion—and higher speeds.
“According to recent studies, there was a significant increase in speeding and even reckless driving during the pandemic, contributing to the severity of crashes and the number of lives lost on our roads during 2020,” the report states.
This further demonstrates the incompatibility between speed and safety.
Because congestion slows drivers, it is thought to reduce the severity of crashes.
“The Highway Safety Manual [published by the American Association of State Highway Transportation Officials (AASHTO)] reports that a 1 mph reduction in operating speeds can result in a 17% decrease in fatal crashes,” according to City Limits, a framework for setting safe speed limits for city streets and providing strategies to manage speed, which was developed by the National Association of City Transportation Officials (NACTO). “A separate study found that a 10% reduction in the average speed resulted in 19% fewer injury crashes, 27% fewer severe crashes, and 34% fewer fatal crashes.”
Thus, the real issue is our values.
Do we value speed for people driving or do we value safety for all people?
Many think that engineers and politicians value speed over safety.
We have proven we can’t have both.
“Prioritizing both safety and keeping cars moving quickly—outside of limited access roads like interstate and freeways—is impossible,” according to Steve Davis of SmartGrowth America.
Why Are Speed and Safety a Matter of Values?
A value is a moral, social, or aesthetic principle accepted by an individual or society as a guide to what is good, desirable, or important, according to the American Psychological Association.
In a guest supplement in the Dangerous by Design report, transportation engineer Charles Marohn explains that engineers do not share our values because they do not recognize their values as values.
In other words, transportation engineers fail to recognize what guides them in determining what is good, desirable, or important.
This is likely rooted in the historic assumption that transportation planning is based on rational, objective, and scientific knowledge.
Traditionally, transportation planners and engineers have not had to justify their work from a values standpoint. Rather, inherent in rationality, these technocrats have suggested that through education, training, and technical tools, they are uniquely positioned to determine what constitutes the politically neutral public interest.
Thus, their shared values are often based on normative ethical judgements, and they have been largely unaware of how their value-based judgements guide their decision-making processes.
Marohn points out the incoherence of engineers’ simultaneous claims that high speeds are a design issue and that low speeds are an enforcement issue. Dangerous by Design also includes a guest supplement on the shortcomings of relying on enforcement and the importance of prioritizing safer design over enforcement.
“The design of streets begins with the establishment of priorities,” Marohn states. “It begins with an application of core values.”
Marohn says engineers lack the qualifications to apply core values and should not be responsible for imposing such values.
Rather, to apply core values and establish priorities, Marohn recommends engineers provide policymakers with the full range of alternatives and tradeoffs and recommends policymakers engage community members about values.
Transportation decisions can no longer be justified as being value-free and objective. We can no longer allow transportation planners, engineers, and agencies to mislead us into thinking they can achieve both speed and safety, according to Dangerous by Design.
The data supports the need to prioritize safety over speed.
It is time we have the difficult values conversation about “speed vs. safety.” And that conversation should involve elected officials and members of the public.
What You Can Do for Safer Roads for Pedestrians?
Recommendations from Dangerous by Design 2022 include:
- Demand better crash reporting and data collection on pedestrian deaths at the local level, to include race/ethnicity information.
- Demand comprehensive data collection on walking at the federal level.
- Urge the U.S. Department of Transportation (USDOT) to adopt the position that safety and speed are incompatible goals in towns and cities.
- Urge USDOT to stop allowing transportation agencies to claim safety benefits from congestion reduction projects.
- Urge USDOT to steer more funding toward improving safety, and provide transparent reporting on state spending.
- Urge the National Highway Traffic Safety Administration (NHTSA) to improve their New Car Assessment Program to consider vehicle design (height, weight, and bumper), crashworthiness for people outside the vehicle, and direct visibility from the driver’s seat.
- Urge the Federal Highway Administration (FHWA) to update design standards, like those in the Manual on Uniform Traffic Control Devices (MUTCD), to stop prioritizing vehicle speed over safety.
- Urge Congress to fully fund all programs intended for combating the rising rates of pedestrian fatalities.
- Urge Congress to enable stronger federal action by directing USDOT and FHWA to release stronger rules and guidance on protecting vulnerable road users.
- Urge states to make safety the top priority governing all street design decisions.
- Urge states to use the enormous freedom and flexibility of federal highway funds to prioritize safety.
Marohn recommends:
- If you are an elected official, demand that you and your elected colleagues set the design speed on your streets.
- If you are a member of the public concerned about the health and safety of your community, demand that the design speed of your streets be part of the conversation.
Explore More:
Transportation & MobilityBy The Numbers
27
percent
of Latinos rely on public transit (compared to 14% of whites).

