
Share On Social!
Education. Access to medical care. Healthy food and safe places to play. Even housing.
All these influence your health.
That’s why annually, since 2010, the Robert Wood Johnson Foundation has released its County Health Rankings so each state can see how its counties compare on more than 30 factors that impact health, income, education, transportation, jobs, and more.
The rankings help us understand what is making people sick or healthy, and what we can do to create healthier places to live, learn, work, and play.
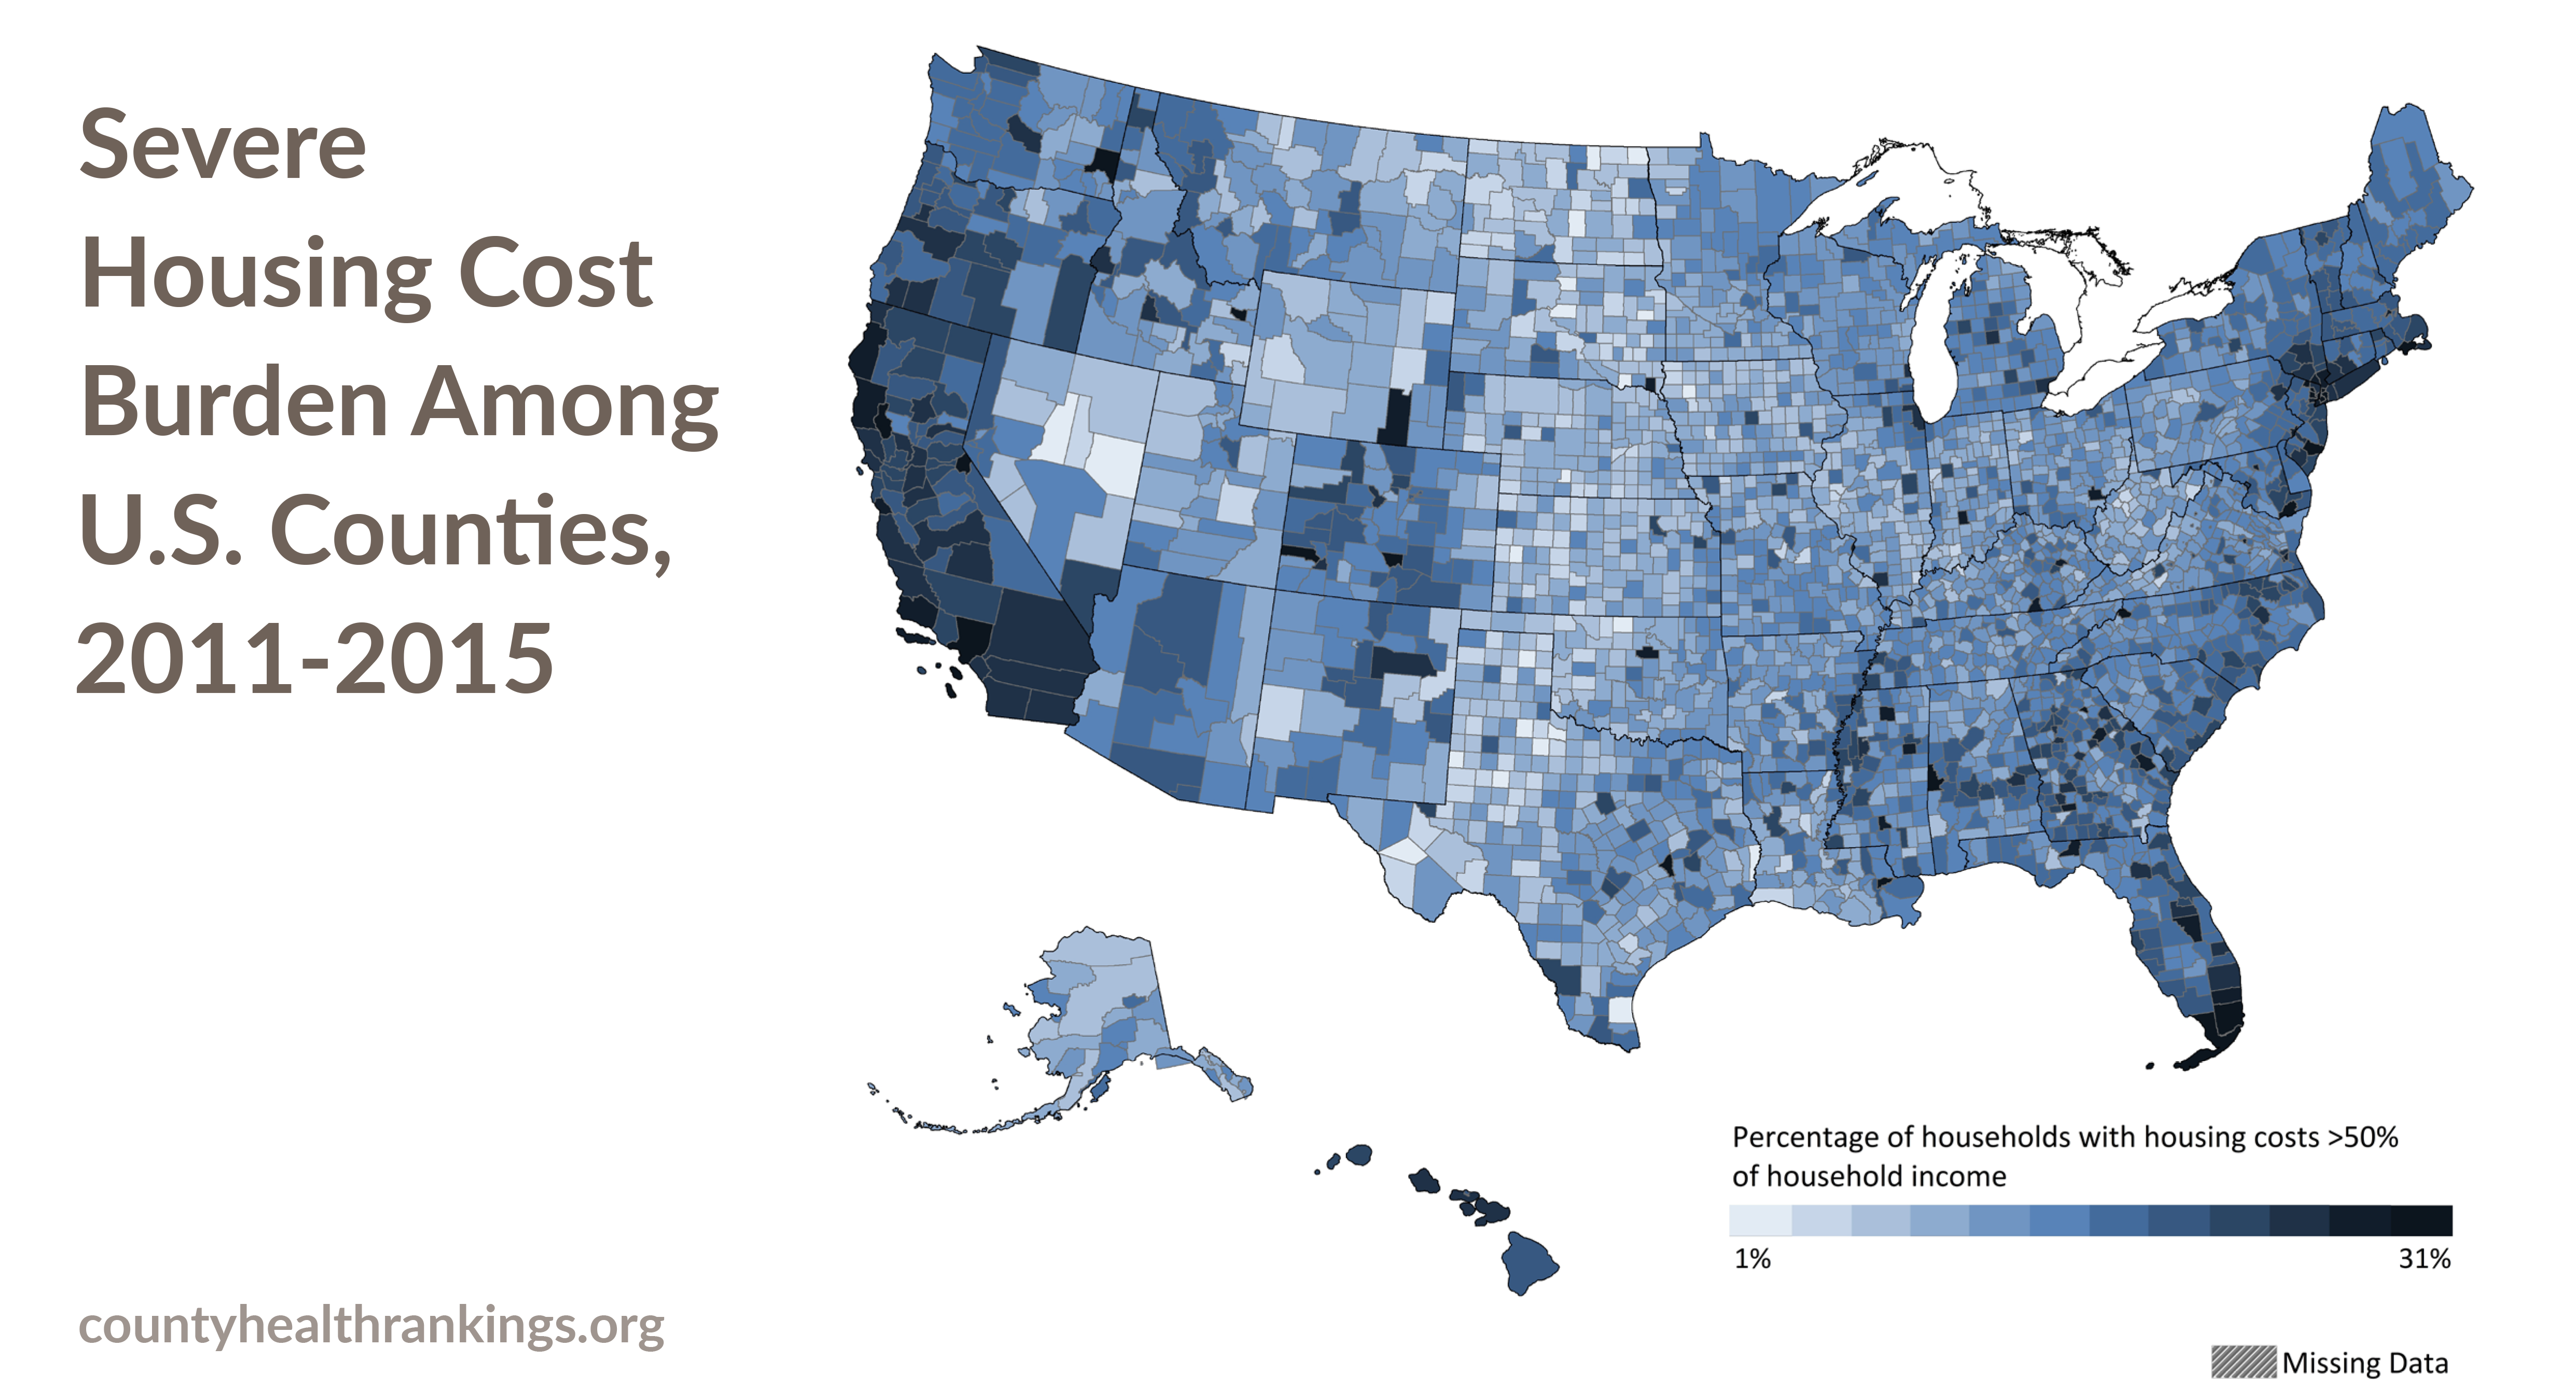
This year’s rankings took a deep dive into a new area: housing and health.
Housing Ownership in Largely Latino Counties
Owning a home can, over time, help build savings for education or for other opportunities important to health and future family wealth.
However, home ownership is still out of reach for many Latinos.
In many states, Latinos are among the worst 10% of counties for home ownership.
In Harris County, Texas (45% Latino), only 55% of people own their own home compared to the state average 62%. In Miami-Dade, Florida (68.6% Latino), only 52% of people own their own home compared to the state average 65%.
Without policies to create or preserve stable and affordable homes, these families are also at risk for displacement due to gentrification.
“Many households are just one unforeseen event – an illness, job loss, financial crisis, or even a drop in hours at work – from losing their home,” according to the 2019 County Health Rankings Key Findings Report.
Housing Costs in Largely Latino Counties
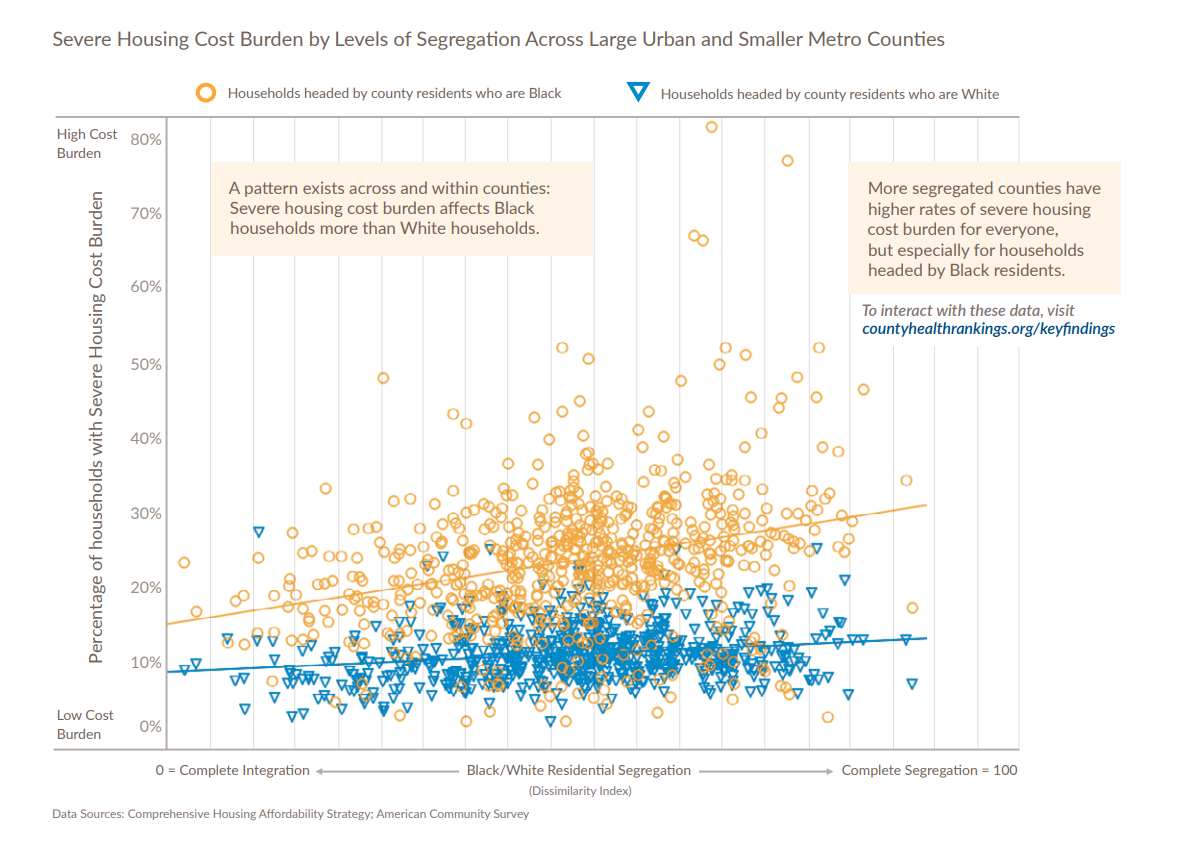
Families in Latino-majority counties are severely housing cost-burdened. They pay more than half their incomes on housing, according to the rankings.
 In Bernalillo County, New Mexico (50.1% Latino), 17% of families are severely housing cost burdened. In Clark County, Nevada (31.3% Latino), 17% of households are severely housing cost burdened. In Miami-Dade, Florida (68.6% Latino), 27% of families are severely housing cost burdened. Families in counties with higher levels of racial and/or economic segregation have higher rates of severe housing cost burden.
These families have little money left over to pay for other essentials that contribute to good health, such as healthy food, medicine or transportation to work and school. They face higher rates of food insecurity, child poverty, and fair or poor health.
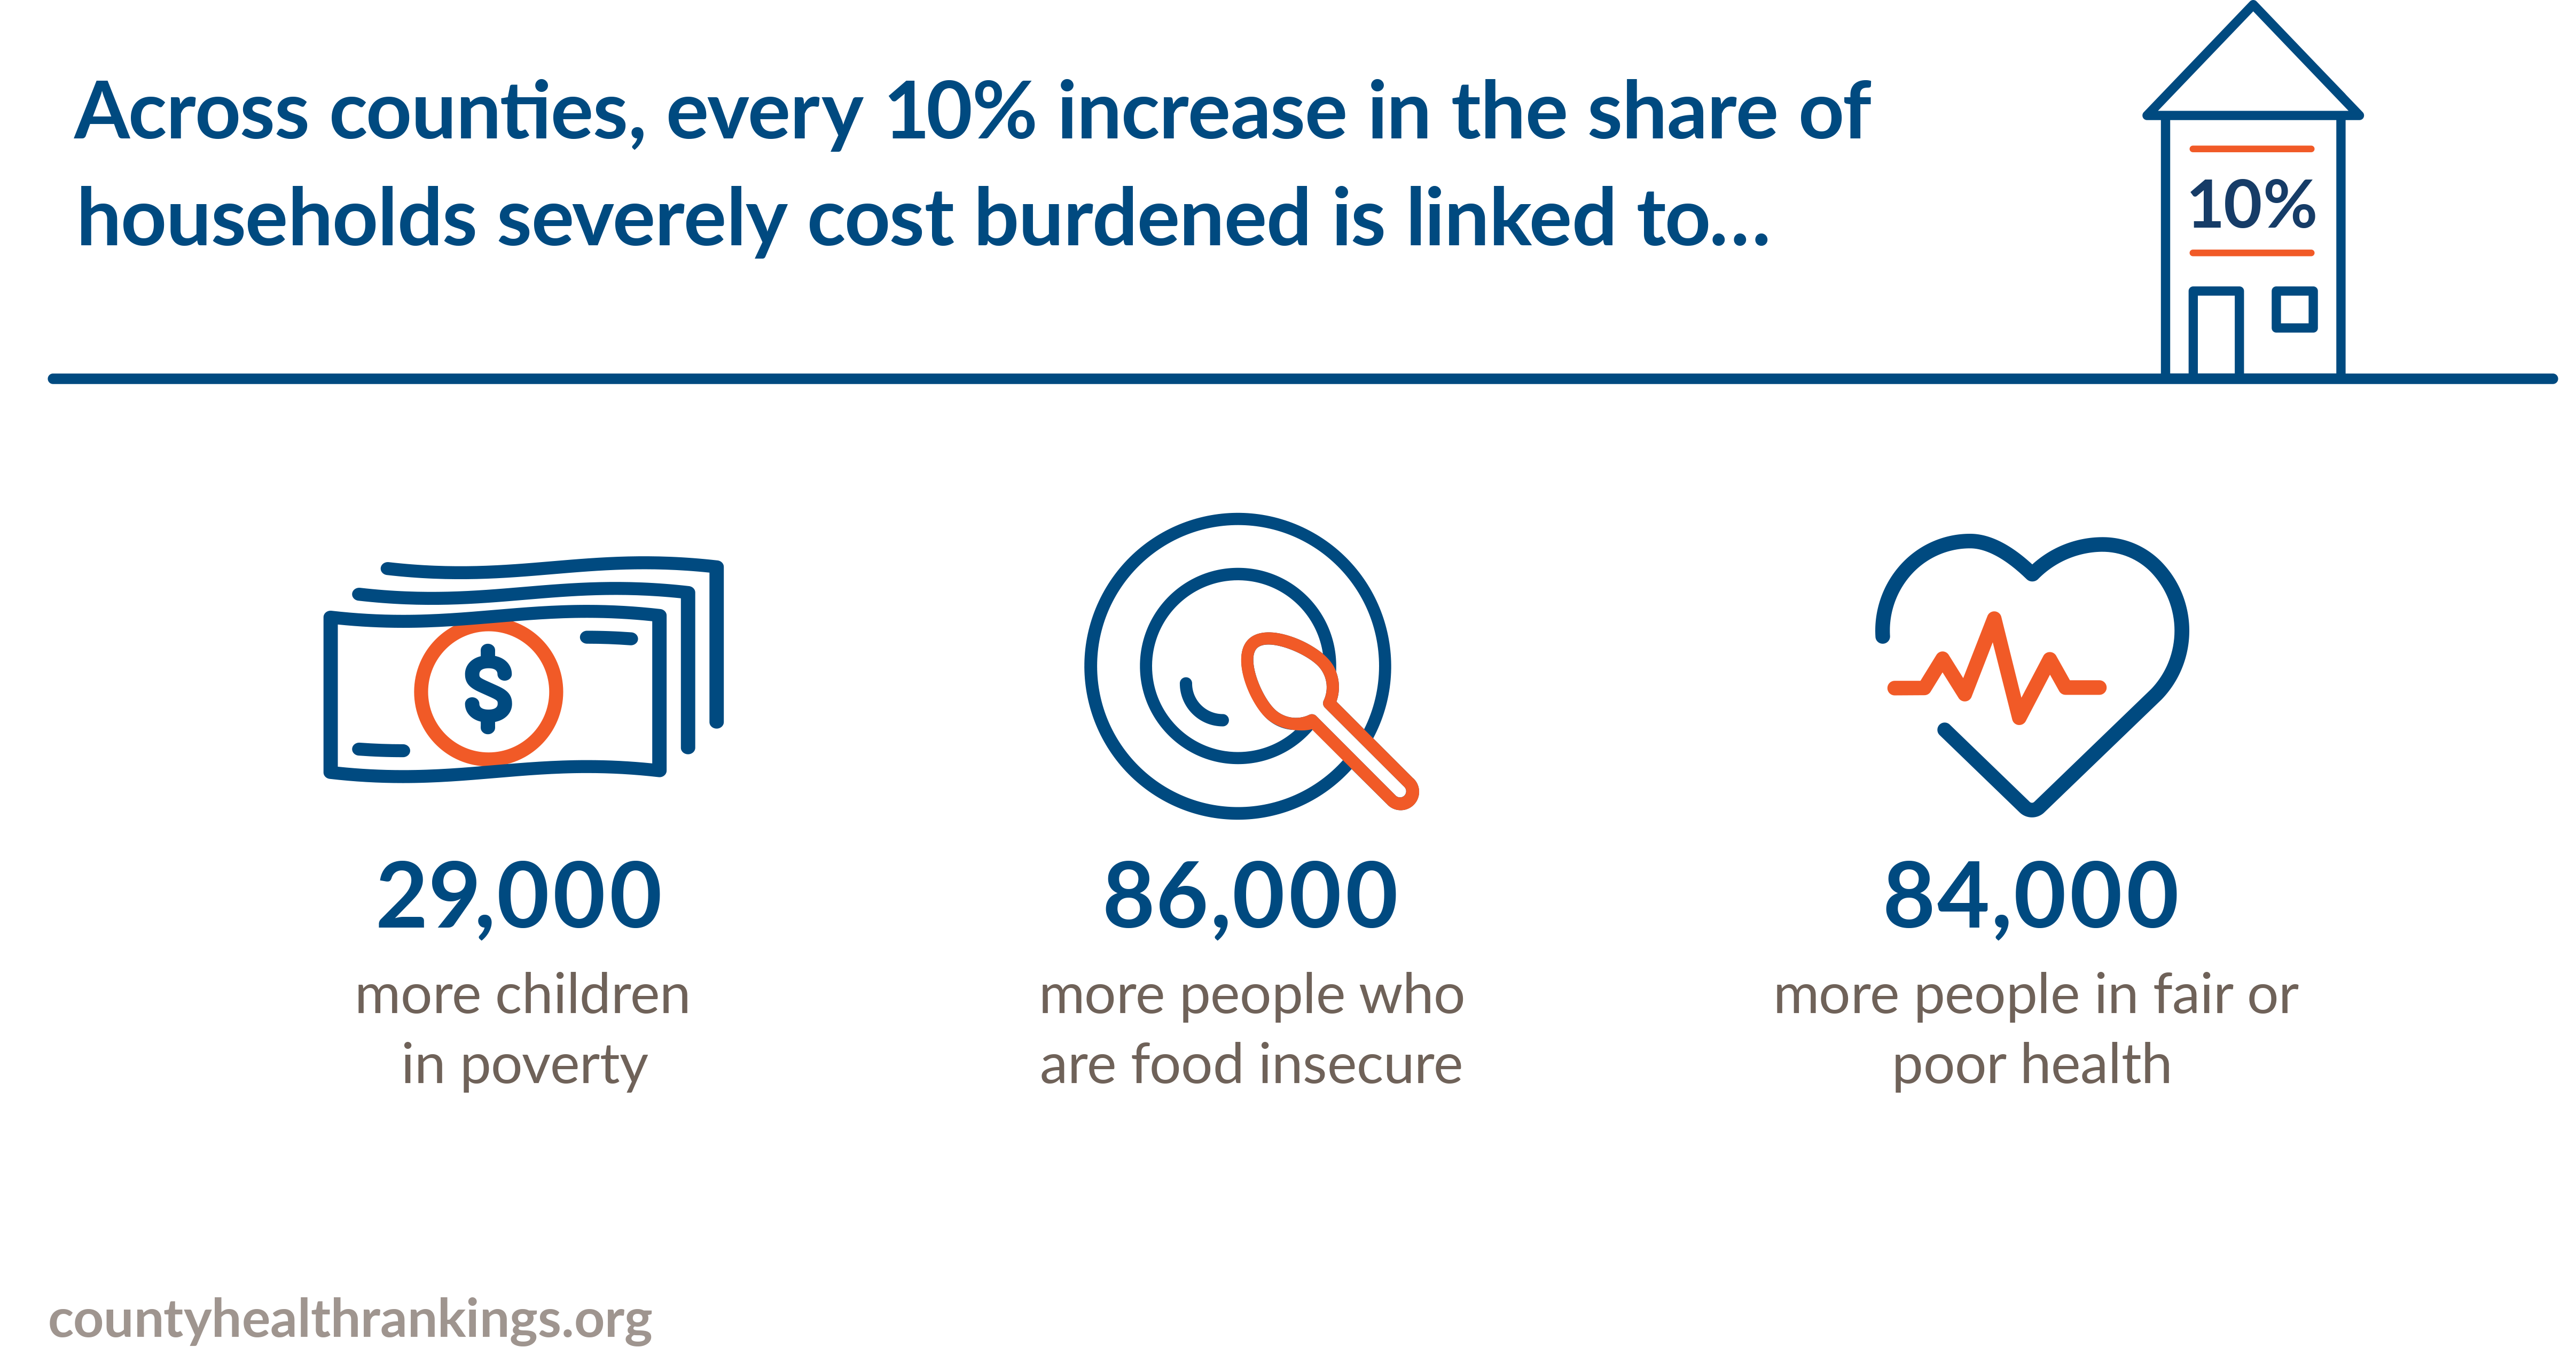
Across counties, every 10% increase in the share of cost-burdened households is linked to:
- 29,000 more children in poverty;
- 86,000 more people who are food insecure; and
- 84,000 more people in fair or poor health.
Overall County Rankings and the Impact on Latinos
Looking at state health reports from seven states with the highest Latino populations—Arizona, California, Colorado, Florida, New Mexico, Nevada, and Texas—Latinos are similar in health to those living in the top or middle healthiest quartile of counties.
However, a deep-dive into the statistics reveal spots for health improvement in these states.
For example, health in this report is determined by premature death, percent of low birth weight newborns and three self-report indicators—percent of people reporting poor or fair health, the number of physically unhealthy days within the last 30 days, and the number of mentally unhealthy days within the last 30 days.
Many counties rank well according to these death and self-report indicators, but rank low for physical environment and social and economic factors.
Miami-Dade County, for examples, ranks 5 of 67 for health outcomes. Yet they rank 50 of 67 for physical environment and 47 of 67 for social and economic factors.
We think it is important to focus on disparities in the physical environment and social and economic factors. These disparities are upstream factors that have a real bearing on downstream health issues.
For example:
Arizona (31.4% Latino). Latinos are among the worst 10% of counties for severe housing cost burden and homeownership. Child poverty rates are higher among Latino children than their white peers. 53% of Arizona’s children in poverty were living in a household that spends more than half of its income on housing costs.
California (39.1% Latino). Latinos are among the worst 10% of counties for severe housing cost burden and homeownership. More Latino children are living in poverty and more Latino families are housing cost burdened than their white peers. Over one million children in California are living in a housing cost burdened household.
Colorado (21.5% Latino). Latinos are among the worst 10% of counties for severe housing cost burden and homeownership. 22% of Latino children live in poverty compared to 9% of white children. 61% of children in poverty are living in a household that spends more than ½ of its income on housing costs. In at least one county, 70% of workers driving alone commute more than 30 minutes.
 Florida (25.6% Latino). Although homeownership rates among Florida counties range from 52% to 90% of households, fewer than 50% of Latinos own their own home. Latinos are among the worst 10% of counties for severe housing cost burden. In at least one county, 62% of workers commute more than 30 minutes.
New Mexico (48.8% Latino). More Latino children live in poverty and more Latino families are severely housing cost burdened than their white peers. Fewer Latino families own their own homes than white families.
Nevada (28.8% Latino). Although homeownership rates among Nevada counties range from 53% to 83% of households, fewer than half of Latinos own their own homes. Although across Nevada counties, severe housing cost burden ranges from 0% to 17% households, more than 17% of Latinos families are severely housing cost burdened.
Texas (39.4% Latino). Twice as many Latinos (26%) have poor or fair health than their white peers (13%). Across Texas counties, severe housing cost burden ranges from 2% to 24% of households, and Latinos are among the worst 10% of counties. Latinos are also among the worst 105 of counties for homeownership
What Can You Do Now?
Search for your county. Snapshots also are available in Spanish. Select the “Español” button in the top right corner of your snapshot to change the language.
Download a state report.
Dig into the local data to better understand health in your community.
Implement strategies to create health equity—where everyone has a fair and just chance to lead the healthiest life possible.
Promote or advocate for strategies to create communities where everyone has a fair and just chance to lead the healthiest life possible. Check out What Works for Health, the rankings’ database of more than 400 evidence-informed strategies to support local changemakers.
For example, making communities more inclusive and connected through inclusive zoning, fair housing laws, and access to public transportation can improve economic and social wellbeing.
Need help?
Tune in on Twitter for our #SaludTues Tweetchat to explore the County Health Rankings at 1 p.m. EST April 16, 2019. Register for the County Health Rankings and Roadmaps 101 webinar at 3 p.m. EST April 23, 2019.
By The Numbers
56.9
percent
of Latinos are "housing cost burdened"