Share On Social!
This is part of our Sugary Drinks & Latino Kids: A Research Review »
Sugary drink consumption among infants, toddlers
In the largest longitudinal study of infant feeding practices in the U.S., the Infant Feeding Practices Study II (IFPS II), prevalence of any SSB intake during infancy (between ages 1-12 months) was 25.9 percent in 2005-2007.5
Research from the 2008 Feeding Infants and Toddlers Study (FITS), a cross-sectional survey describing infant feeding practices, nutrient intake, and food consumption patterns of U.S. infants and young children, showed that:
- 0.6 percent of infants ages 4-5.9 months
- 5 percent of infants 6-8.9 months
- and 10.7 percent of infants 9-11.9 months consumed SSBs at least once in a day.6
Prevalence of SSB consumption in a given day was:
- 14.3 percent among toddlers 12-14.9 months
- 29.4 percent among 15-17.9 months
- 28.6 percent among 18-20.9 months
- and 38.2 percent among 21-23.9 months in the FITS study.6
This represented a significant decrease from 2002 SSB consumption among toddlers 12-14.9 and 18-20.9 months (p<0.01), but no significant change among toddlers 15-17.9 and 21-23.9 months.
Among older toddlers participating in the 2008 FITS study, 44 percent of 2-year-olds and 48 percent of 3-year-olds consumed some type of SSB, with fruit-flavored drinks being the most popular.7
SSB consumption has decreased in recent years among 2-5-year-olds; however, 4.5 percent of total calories still came from SSBs among this age group in 2009-2010.8
Sugary drinks and long-term taste preferences
Early introduction of SSBs may influence young children’s taste preferences for sweet foods and beverages later in life.9
Any SSB intake during infancy (up to 12 months of age), for example, was associated with significantly increased likelihood of consuming SSBs at least once a day at age 6 in an analysis of longitudinal data from the 2005-2007 IFPS II and 2012 Follow-Up Study.10
One-third (33.1%) of youth ages 2-19 consumed one SSB on a given day in 2009-2010, while 31.2 percent reported consuming two or more servings on a given day, according to data from the National Health and Nutrition Examination Survey (NHANES).8 Average daily caloric intake from SSBs among those ages 2-5 was 69 calories.8
A recent study using NHANES data, this time examining beverages sweetened both before and after purchase, found that SSBs accounted for 7.9 percent of total daily calories among children and adults ages 2 or older.11
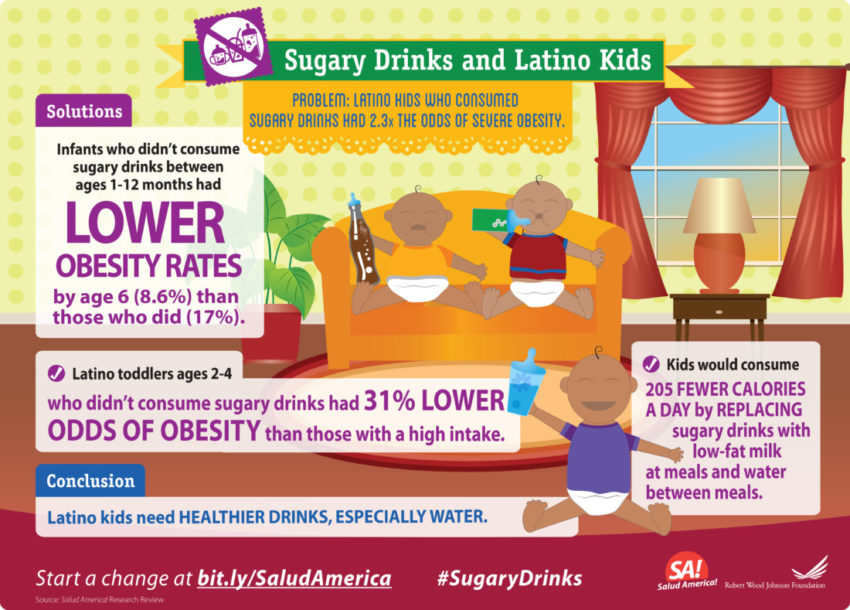
Recent simulation analyses based on 2005 School Nutrition Dietary Assessment data estimated that children would consume 205 fewer calories per day—roughly 10 percent of their daily total—by replacing their SSB and flavored milk consumption with unflavored low-fat milk at meals and water between meals.12
Similarly, an analysis of children’s dietary intakes from the 2003-2004 NHANES estimated that replacement of SSB consumption with water would result in an average daily decrease of 235 calories consumed.13
Latino kids consume high rates of sugary drinks
Minority youths, including Latinos, drink more SSBs than their non-Latino White peers; disparities in SSB consumption are seen as early as 6-11 months of age.
By age 2, 74 percent of Latino children have consumed some SSBs, compared with 82 percent of African American children and 45 percent of non-Hispanic Whites, according to a study of 1,116 mother-child pairs participating in Project Viva.
The same study showed that after adjusting for age, sex and energy intake, SSB consumption among African American and Latino 3-year-old children was more than three times greater and more than double, respectively, compared to white children.14 These differences remained significant after controlling for maternal age, education, household income and maternal immigrant status.
One national study based on 2002 survey data found that Hispanic infants and toddlers in the U.S. were significantly more likely to be fed sweetened fruit-flavored drinks at 6-11 months (13.2% vs. 5.4%) and at 12-24 months (47.0% vs. 29.5%) compared to non-Hispanic infants and toddlers.15 This study also noted that in several parts of Mexico sweetened drinks were routinely fed to infants to prevent or treat colic.
Another study of SSB and 100 percent fruit juice consumption among children in California found that Latino race/ethnicity was associated with 1.35 and 1.46 times higher odds of consuming any SSBs among children ages 2-5.16
Research based on national surveillance data shows that from 1988-1994 to 1999-2004, SSB consumption increased significantly more among Mexican American children ages 2-5 (and among children in older age groups) than it did among non-Hispanic white children and adolescents.17
NHANES data from 2009-2010 show that Mexican American children ages 2-5 consume more daily calories from SSBs than their non-Hispanic white counterparts (but less than non-Hispanic black children).8
From 2003 to 2009, the consumption of 100 percent fruit juice per day increased among Latino children and decreased among White children, according to a study of children in California.16
A 2016 study of 8,950 children demonstrated that drinking 100 percent fruit juice regularly at age 2 was associated with an increased odds (adjusted odds ratio, 1.30 [95% CI, 1.06-1.60]) of becoming overweight by age 4 compared with infrequently drinking or not drinking 100 percent fruit juice.18
Although not the focus of this research review, several studies indicate that these racial/ethnic disparities in SSB consumption continue among Latino children in older age groups, including Latino students in grades 4-6,19 Latino children ages 6-11 and 12-19,8 and Latino high-school student.20,21
More from our Sugary Drinks & Latino Kids: A Research Review »
- Introduction & Methods
- Key Research Finding: Latino kids’ sugary drink consumption (this section)
- Key Research Finding: Weight gain
- Key Research Finding: Marketing
- Key Research Finding: Childcare settings
- Key Research Finding: Pricing
- Key Research Finding: Water
- Policy Implications
- Future Research Needs
References for this section »
5. Pan, L. et al. A Longitudinal Analysis of Sugar-Sweetened Beverage Intake in Infancy and Obesity at 6 Years. Pediatrics 134, S29–S35 (2014).
6. Siega-Riz, A. M. et al. Food Consumption Patterns of Infants and Toddlers: Where Are We Now? Journal of the American Dietetic Association 110, S38–S51 (2010).
7. Fox, M. K., Condon, E., Briefel, R. R., Reidy, K. C. & Deming, D. M. Food Consumption Patterns of Young Preschoolers: Are They Starting Off on the Right Path? Journal of the American Dietetic Association 110, S52–S59 (2010).
8. Kit, B. K., Fakhouri, T. H., Park, S., Nielsen, S. J. & Ogden, C. L. Trends in sugar-sweetened beverage consumption among youth and adults in the United States: 1999–2010. Am J Clin Nutr 98, 180–188 (2013).
9. Pepino, M. Y. & Mennella, J. A. Sucrose-induced analgesia is related to sweet preferences in children but not adults. Pain 119, 210–218 (2005).
10. Park, S., Pan, L., Sherry, B. & Li, R. The association of sugar-sweetened beverage intake during infancy with sugar-sweetened beverage intake at 6 years of age. Pediatrics 134 Suppl 1, S56-62 (2014).
11. Miller, P. E. et al. Sugar-Sweetened Beverage Consumption in the U.S.: Novel Assessment Methodology. American Journal of Preventive Medicine 45, 416–421 (2013).
12. Briefel, R. R., Wilson, A., Cabili, C. & Hedley Dodd, A. Reducing Calories and Added Sugars by Improving Children’s Beverage Choices. Journal of the Academy of Nutrition and Dietetics 113, 269–275 (2013).
13. Wang, Y. C., Ludwig, D. S., Sonneville, K. & Gortmaker, S. L. Impact of change in sweetened caloric beverage consumption on energy intake among children and adolescents. JAMA Pediatrics 336–343 (2009).
14. de Hoog, M. L. A. et al. Racial/ethnic and immigrant differences in early childhood diet quality. Public Health Nutr 17, 1308–1317 (2014).
15. Mennella, J. A., Ziegler, P., Briefel, R. & Novak, T. Feeding Infants and Toddlers Study: The Types of Foods Fed to Hispanic Infants and Toddlers. 96–106 (2006).
16. Beck, A. L., Patel, A. & Madsen, K. Trends in Sugar-Sweetened Beverage and 100% Fruit Juice Consumption Among California Children. Academic Pediatrics 13, 364–370 (2013).
17. Wang, Y. C., Bleich, S. N. & Gortmaker, S. L. Increasing Caloric Contribution From Sugar-Sweetened Beverages and 100% Fruit Juices Among US Children and Adolescents, 1988-2004. e1604–e1614 (2008).
18. Nagata JM, Djafari JT & Chamberlain LJ. The option of replacing the special supplemental nutrition program for women, infants, and children fruit juice supplements with fresh fruits and vegetables. JAMA Pediatr 170, 823–824 (2016).
19. Cullen, K. W., Ash, D. M., Warneke, C. & de Moor, C. Intake of Soft Drinks, Fruit-Flavored Beverages, and Fruits and Vegetables by Children in Grades 4 Through 6. Am J Public Health 92, 1475–1477 (2002).
20. Park, S., Blanck, H. M., Sherry, B., Brener, N. & O’Toole, T. Factors Associated with Sugar-Sweetened Beverage Intake among United States High School Students. J. Nutr. 142, 306–312 (2012).
21. Center for Disease Control and Prevention (CDC). Beverage Consumption Among High School Students — United States, 2010. (2011).
By The Numbers
1
Supermarket
for every Latino neighborhood, compared to 3 for every non-Latino neighborhood