Share On Social!
Do you know how roadways are graded?
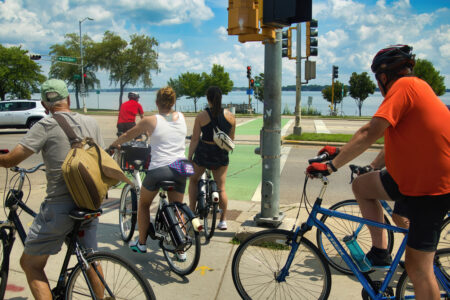
Most transportation indicators grade based on the level of motor vehicle traffic on a road, with little consideration for people walking, bike or taking transit, and vehicle travel.
This leads planners to design car-focused roads that neglect transit and non-motorized travel, which is counterproductive to social, environmental, and health goals.
Using level of service (LOS), for example, to assess road performance tends to expand roadways and increase vehicular speeds to benefit cars and trucks only. This ends up enabling more vehicle travel and reducing feasibility of walking, biking, and busing.
That’s why five early-adopter cities in California transitioned away from a narrow focus on moving as many cars as fast as possible, to a more comprehensive method focused on options to reduce vehicle travel and enhance healthier, more equitable travel alternatives.
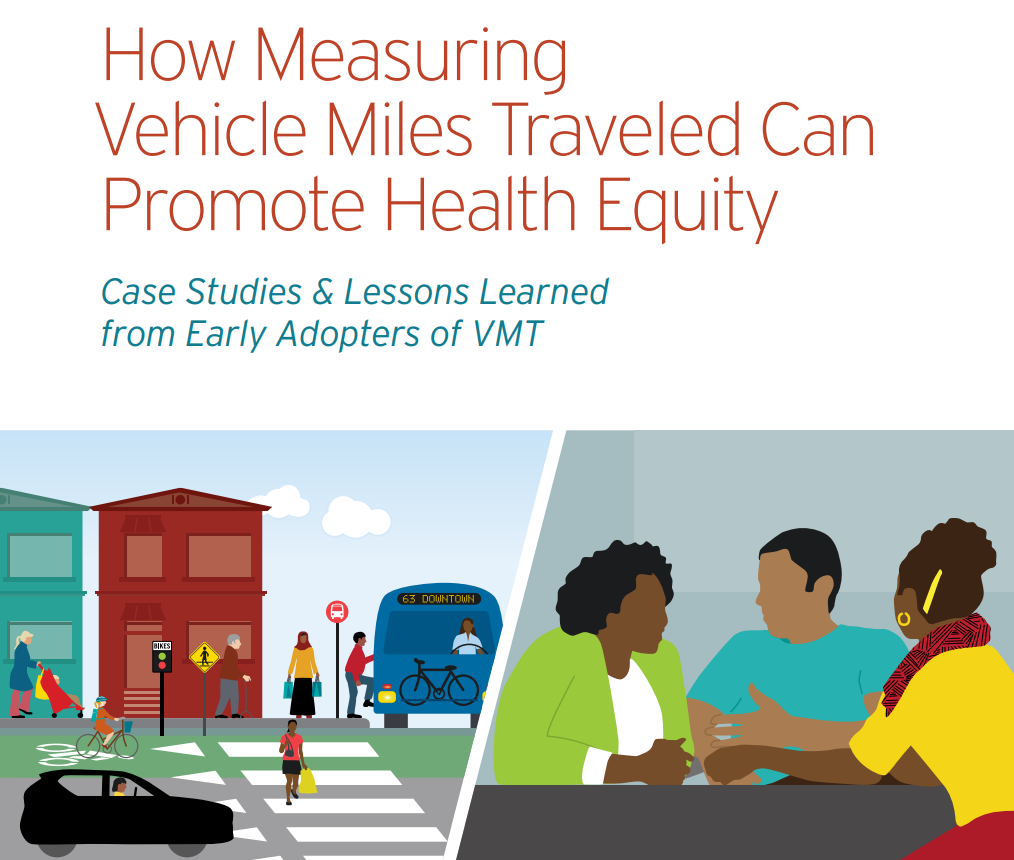
ChangeLab Solutions studied these cities to provide how-to guidance on their transition.
Level of Service as the Primary Measure Increases Vehicle Travel
Indicators that measure transportation system performance are useful for identifying trends, anticipating problems, establishing targets, and assessing progress.
Though there are no formal or federal requirements to do so, most departments of transportation (DOTs), metropolitan planning organizations (MPOS), and traffic engineers rely on an indicator known as level of service (LOS), according to Steven Lee Davis with Transportation For America.
“Level of service is a system by which road engineers measure how well a road is performing based on the number of cars and the delay that vehicles experience on that roadway,” according to Davis. “Letters designate each level, from A to F. A, B and C represent free-flowing conditions and F is stop-and-go traffic. The score is assessed based on the highest level of congestion on that roadway, even if it only occurs a few minutes a day.”
Evaluating roadway LOS generally considers traffic congestion the primary problem and roadway expansion the primary solution. Thus projects to expand roadway capacity and speeds are prioritized.
Evaluating roadway LOS reinforces a cycle of auto-dominance.
Evaluating roadway LOS results in a trade-off between speed for people driving and safety for people walking, biking, and busing.
Evaluating roadway LOS a poor measure of the impact of land use and transportation projects when you consider transit, non-motorized travel, health, equity, and sustainability.
“[LOS] tends to justify policies and projects that increase motorized travel,” according to a report from the Victoria Transport Policy Institute. “For example, they justify road and parking facility capacity expansion that tends to create more automobile-oriented transport and land use systems, increasing per capita vehicle travel and reducing the viability of walking, cycling and public transit.”
What Vehicle Travel Has To Do With Health
More vehicle travel is associated with:
- Higher rates of motor vehicle and pedestrian crash deaths and injuries;
- More greenhouse gas emissions and pollutants (exhaust and non-exhaust) in our air and our water. This is especially a problem for Latino populations;
- Higher costs for maintenance, parking, building energy, and water, as well as higher costs for households;
- Economic segregation and limited access to critical amenities and destinations, such as quality child care, affordable housing, and employment opportunities. Latinos also suffer inequities in access to many of these health-promoting assets; and
- Inequities in life expectancy and prevalence and severity of chronic disease, such as diabetes, obesity, and asthma; Latinos suffer vast health inequities, including high rates of childhood obesity and adult obesity.
How Should the Health Effects of Vehicle Travel Impact Road Design and Assessment?
Many cities are facing financial, health, and climate problems resulting in fewer people owning vehicles and more people walking, biking, and taking transit.
“Traffic engineers are trained to solve a narrow set of problems, but those are not the problems our cities face today,” Tweeted @StrongTowns.
Transportation system performance is far more complex than congestion. It requires more comprehensive methods of analysis.
Cities need transportation indicators to account for the safety and mobility of these people, as well as overlapping social, environmental and health goals.
Vehicle miles traveled (VMT), for example, is a more appropriate indicator of transportation impacts than vehicle congestion.
The goal should be to reduce the amount and distance of vehicle travel produced by transportation and land use projects.
Moreover, the tradeoff between speed for people driving and safety for people walking, biking and busing should be a community decision with a transparent process.
Elected officials must be given the options. LOS denies options.
How to Transition From Level of Service to Vehicle Miles Traveled
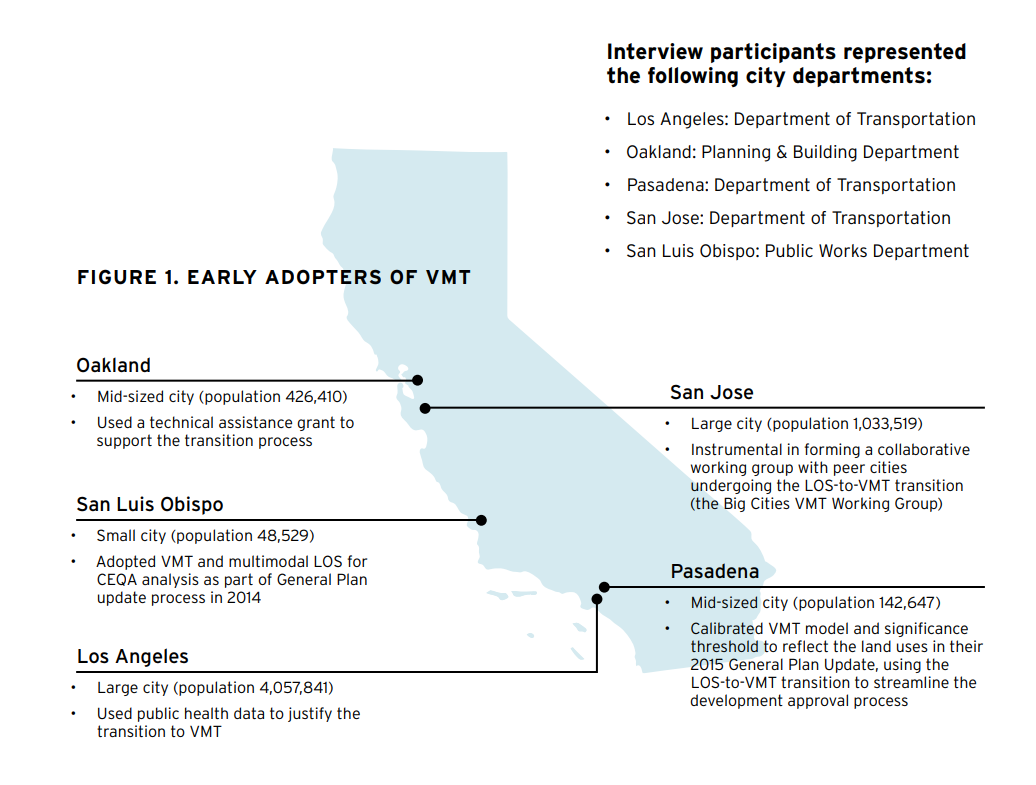
Five cities across California have already made this transition, according to ChangeLab’s case studies.
 They provide how-to guidance on the three core phases of the transition:
- Preparation: Educate stakeholders, build internal capacity of staff who will oversee the process, and align planning or policy efforts with new method of analysis.
- Vehicle Miles Traveled (VMT) Modeling: Identify existing and new methods for estimating the amount of VMT a project will generate and decide on the threshold of how much VMT represents a significant impact.
- Implementation: Create a process for integrating VMT into planning and project development processes. Could be general plan update or on project-by-project basis.
In VMT analysis, the threshold of significance for VMT is the minimum amount of additional VMT than can be associated with a project or plan before it is deeming to have a significant impact.
Agencies may choose to use screening thresholds—special criteria that can help decisionmakers quickly identify whether a project is expected to cause a significant impact without conducting a detailed study, according to the report.
Examples of screening thresholds include:
- Transit and active transportation projects generally reduce VMT and therefore are presumed to cause a less-than-significant impact on transportation.
- Adding affordable housing to infill locations generally makes jobs more access to housing, meaning shorter commutes and less VTM.
- Projects within a half-mile of an existing major transit stop or an existing stop along a high-quality transit corridor will have a less-than-significant impact on VMT.
VMT analysis may be implemented through an ongoing planning process, such as a general plan update, or on a project-by-project basis, according to the report.
Challenges for early adopters include: communicating changes to city staff; developing VMT estimation methods; and addressing legacy LOS projects.
Lead agencies and partners should make the public health and equity considerations explicit.
For example, Pasadena’s city staff did not use public health justifications or research, but in hindsight, they felt that would have been a great set of evidence to use, according to the report.
Use these case studies and how-to guide to urge leaders to transition away from LOS toward VMT to address climate, sustainability, and public health goals.
Now, California is making it a statewide priority to shift away from auto-oriented level-of-service (LOS) measures to more multimodal vehicle miles traveled (VMT).
“Planning and transportation measurements shape whether built environments are safe and beneficial to health or focused on other priorities like promoting automobile transportation,” according to ChangeLabs.
By The Numbers
27
percent
of Latinos rely on public transit (compared to 14% of whites).