Share On Social!
Check out USDA’s new data tool called the Child Nutrition Dashboard!
The dashboard, which is comprised of public data published in the child nutrition tables, can help federal, state, and local organizations assess trends in child nutrition program activity.
“The goal of the dashboard is to provide national and state level visualization of meals served, participation, and funding data for the National School Lunch Program, School Breakfast Program, Child and Adult Care Food Program, and Summer Food Service Program,” according to the USDA’s Food and Nutrition Service (FNS).
Let’s dive into how this tool can be used and why it benefits Latinos!
Nutrition Dashboard Insights
The Child Nutrition Dashboard provides information on participation, meals served, and cash payments for Child Nutrition programs for each fiscal year.
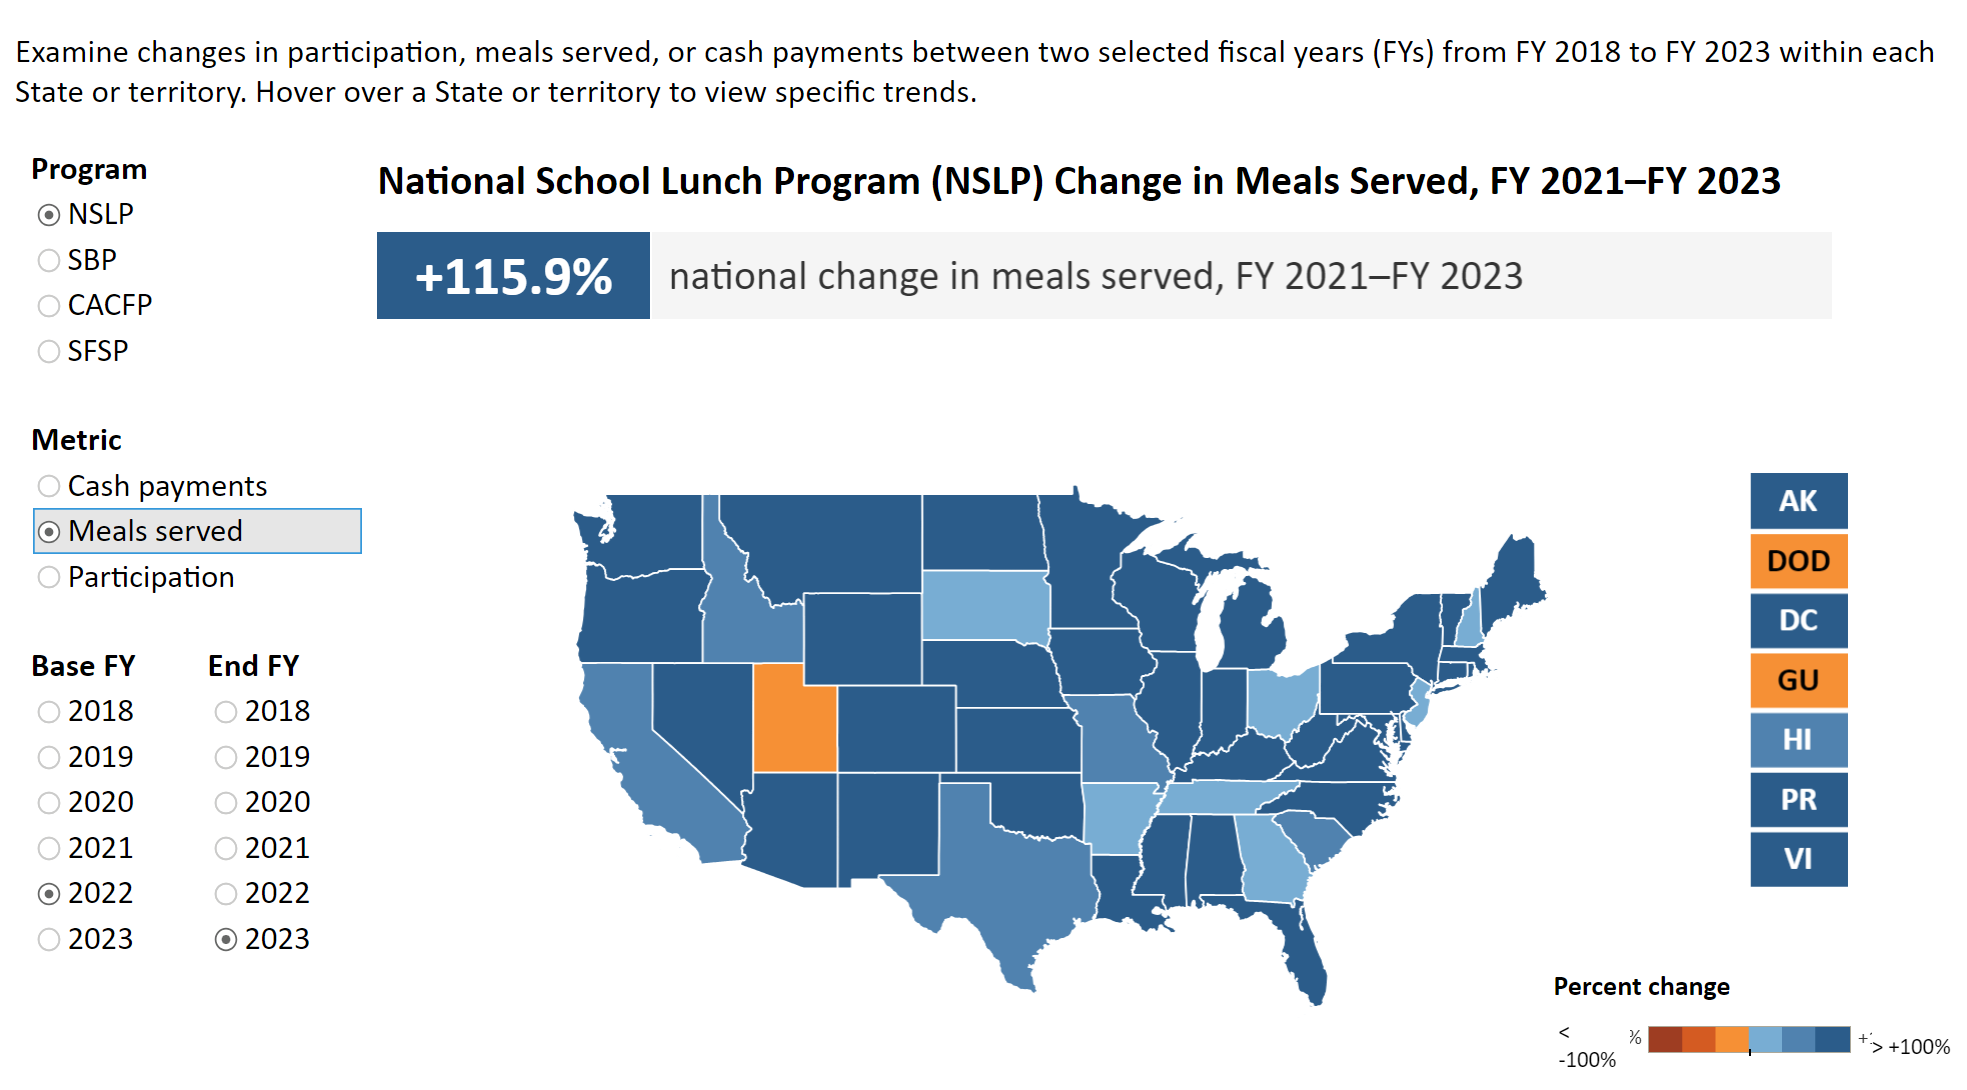
Data covers the:
- Summer Food Services Program (SFSP), a federally funded, state-administered program that provides healthy meals and snacks to children in low-income areas and residential sites during the summer and other times when school isn’t in session.
- Child and Adult Care Food Program (CACFP), which provides healthy meals and snacks for young children in day care home and centers. CACFP also provides meals to youth participating in after-school care programs, children residing in emergency shelters, and adults over the age of 60 or living with a disability and enrolled in day care facilities.
- School Food Program (SBP), providing healthy breakfasts to both public and private schools and childcare institutions.
- National School Lunch Program (NSLP), a federally assisted meal program that provides healthy lunches to public and private schools and childcare institutions.
The dashboard includes summaries of total meals served, state maps, and national trends.
Data from the dashboard also considers how COVID-19 impacted these various meal programs.
“Normal school operations changed during the COVID-19 pandemic. In school year (SY) 2020-2021, many schools served meals through the Summer Food Service Program (SFSP). The following year (SY 2021-2022), schools did not have the option to use the SFSP, but instead were able to serve meals through the Seamless Summer Option (SSO),” according to the USDA.
Find the Children Nutrition Dashboard found here.
Latinos and Nutrition Security
Latinos face barriers when it comes to both food security and nutrition security.
“Fast food and corner stores outnumber supermarkets and farmers’ markets in many Latino neighborhoods, according to a Salud America! resource,” Latino kids also consume more sugary drinks—soda, sports drinks, sugary fruit juices, and flavored milk—than the average child.”
These issues contribute to other health challenges that Latinos face including diabetes, high blood pressure, and obesity, among other health issues.
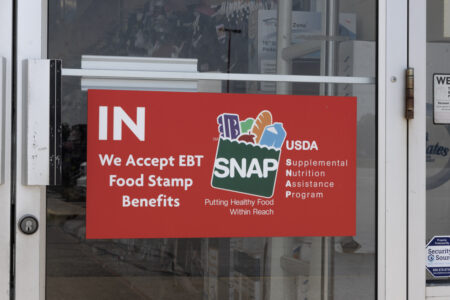
Federal food programs, like school food, plays a vital role in healthy food access.
With this in mind, it’s crucial for healthy food options and programs to be accessible for all, especially within the Latino community.
Promoting Food and Nutrition Security in Your Community
What you eat can contribute to overall health.
But how can you explore what access to nutritious food and programs looks like in your community?
Look to Salud America!’s Health Report Card!
Use the report card as a tool to view data on a variety of topics including housing, food security, and more.
Find data from your area and compare it to other counties and states across the nation.
Use the results to encourage change and have important conversations about health in your area.
Explore More:
Healthy FoodBy The Numbers
1
Supermarket
for every Latino neighborhood, compared to 3 for every non-Latino neighborhood