Share On Social!
Every year, County Health Rankings & Roadmaps (CHR&R) highlights health differences that impact the quality of life and health outcomes of communities.
The report’s data and guidance aim to support community-led efforts to improve health, where everyone has a fair, just opportunity to be their healthiest.
This year, CHR&R focused on two health drivers: civic infrastructure and civic participation.
Let’s explore the report and see how counties compare across the nation, and how civic infrastructure and civic participation affects the health of Latinos and all people.
What is Civic Infrastructure and Civic Participation?
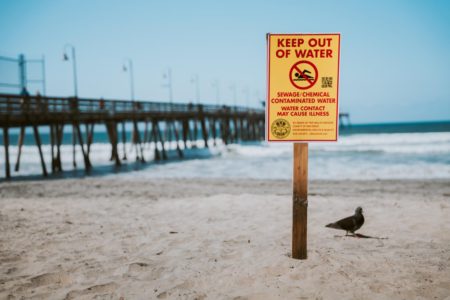
Civic infrastructure provides community members a place to connect. These places include libraries, civic centers, parks, and schools.
Civic participation includes the ways people participate in community life to improve conditions and shape the community’s future.
Civic participation can come in many forms, such as volunteering, serving on local boards, participating in the US census, donating to causes, and voting in political elections.
How Does Civic Infrastructure and Civic Participation Impact Health?
By connecting in civic spaces and participating in community life, community members can express themselves, engage in activities, enjoy nature, experience a sense of belonging, and influence policies and systems change – all of which positively impact mental and physical health.
However, civic infrastructure is not in all US communities, and civic participation requires investment in civic infrastructure.
Many groups, including Latinos, experience the effects of long-standing differences, disinvestment in civic infrastructure, and exclusionary policies and practices that discourage civic participation, according to the CHR&R report.
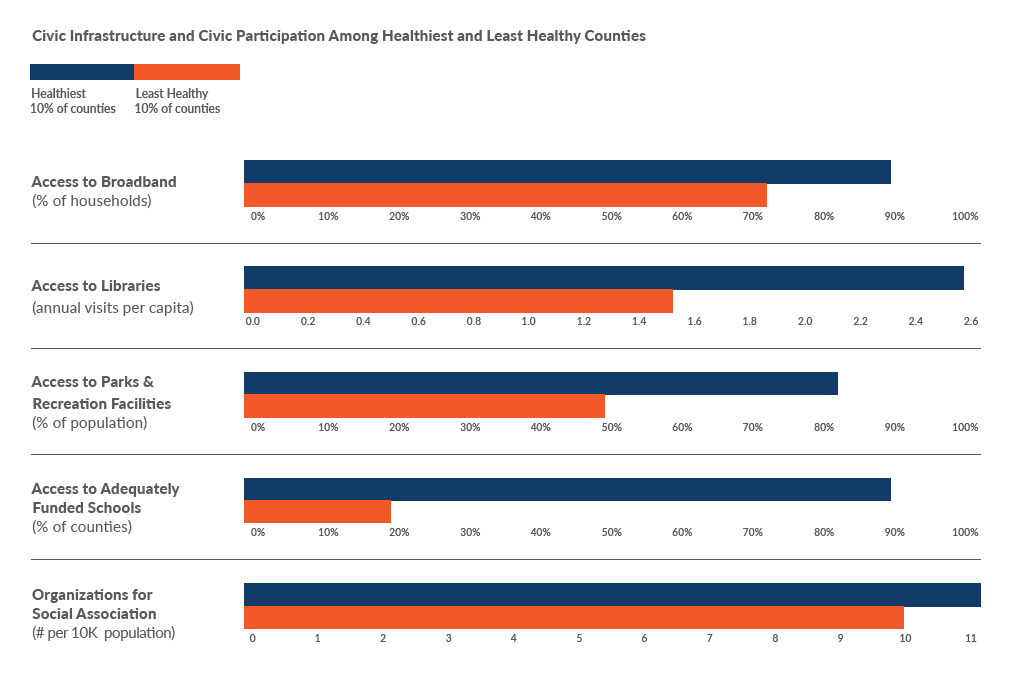
Counties with more available and resourced civic infrastructure, including counties in the Northeast, Midwest, and West, often have more social and economic opportunity, such as opportunities for education, employment, and income.
In these well-resourced regions, approximately 83% of households have access to broadband internet and 66% of the population lives near a park or recreation facility. Most counties have adequate public-school funding to support student achievement of national average test scores.
These counties also have higher rates of civic participation in the form of voter turnout and census participation, according to the report.
Comparatively, counties that have experienced long-standing disinvestment in civic infrastructure, including counties along the US-Mexico Border, Black Belt Region, American Indian/Alaska Native tribal areas, and Appalachia region, have fewer civic participation and opportunities.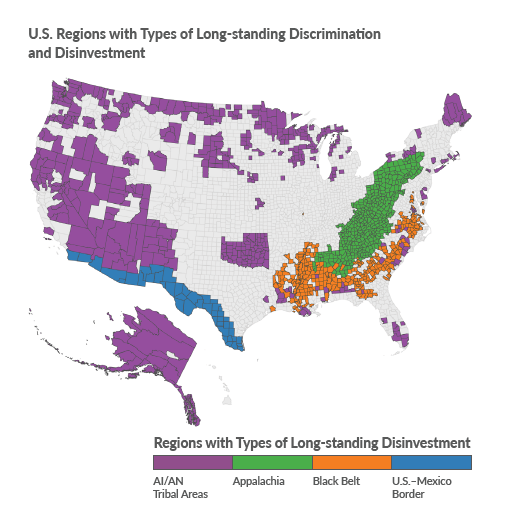
These counties experience higher rates of poverty, lack of health insurance, lower household incomes, and lower rates of high school completion than the rest of the nation’s counties, on average.
In fact, these same underresourced counties are consistently among the least healthy in measures of length and quality of life, according to the report.
Counties with structural barriers to civic health have, on average, three years shorter life expectancy (75.4 years) than counties with fewer structural barriers (78.5 years).
How Can We Improve Civic Infrastructure and Civic Participation?
There are a variety of ways we can help improve civic infrastructure and civic participation – but it’s a collaborative effort.
CHR&R points primarily to policymakers, government leaders, and community leaders to make these changes.
For instance, leaders can push to invest in civic infrastructure that encourages civic participation, like libraries, community centers, community schools, community gardens, and parks.
Read CHR&R’s full list of recommendations!
You can get civically involved, too.
Select your county and get a Report Card by Salud America! at UT Health San Antonio.
In your Report Card, you will see maps, data, and gauges to compare public health issues to the rest of your state and nation.
You can email your Report Card to local leaders to stimulate community change. Use the data in your materials or share on social media to raise awareness about the importance of civic infrastructure and civic participation.
Explore More:
Increasing Civic EngagementBy The Numbers
50
percent
of big U.S cities have a local board of health