Share On Social!
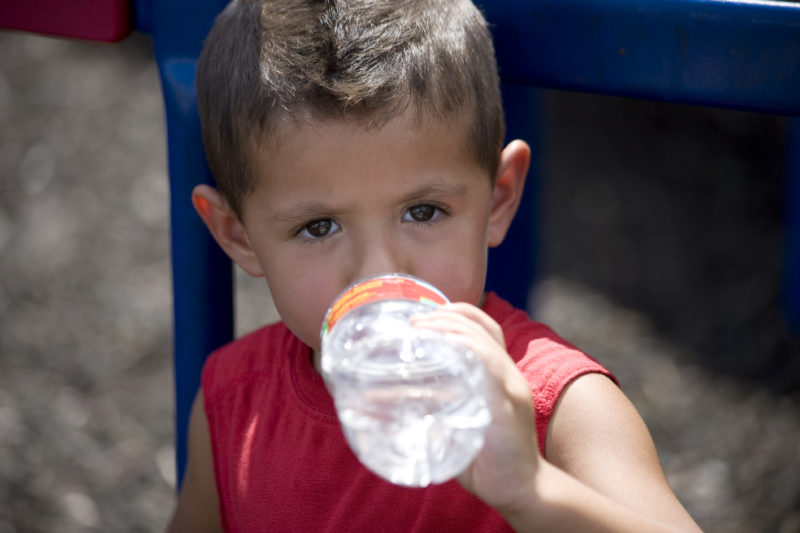
Water bottle sales have nearly tripled compared to the falling rates of soda consumption, reports the New York Times.
This prompts the question, do the studies showing the link between obesity and consumption of sugary beverages make an impact?
J. Alexander M. Douglas Jr., president of Coca-Cola North America, was quoted in the same article: “Health and wellness are a major enduring trend and each brand has to compete in that environment.”
But healthier beverage options are not just trending across certain states. They are being proven as recent market reports show a noticeable decrease in soda consumption. Sugary beverage taxes are not popular in all states, as in California, but a growing amount of sugary beverage consumers may be realizing the health warnings associated with sugary beverage consumption, and adopting healthier beverage options.
States are starting to take action too.
A recent Harvard study reported that Boston is promoting healthy vending initiatives and policies to provide more non-sugary beverages to their citizens. Philadelphia and New York, not far behind, are also taking initiatives. In fact, NYC is currently proposing a rule that bans large sugary beverages to minors.
Shedding light from a global perspective, the UK is also concerned about the sugars in their beverages and how this may be shaping the world’s growing obesity pandemic.
But the beverage industry is fighting back.
Stories from Texas and California show how big soda is trying to quiet educational and anti-sugary beverage campaigns.
However, more is needed to be done in educating the public on sugary beverage consumption.
By The Numbers
1
Supermarket
for every Latino neighborhood, compared to 3 for every non-Latino neighborhood