Share On Social!
Childhood obesity is getting worse over time, especially for Latinos.
Researchers in Texas (39.4% Latino) recently released a data explorer that illustrates trends in body mass index of school-aged children in their state (52% Latino). It also reveals underlying factors in obesity, such as dietary behaviors and physical activity.
The information showed many disparities, especially in the Latino community — numbers that could call for statewide, national conversation and legislation concerning childhood obesity.
Need for Obesity Reduction
U.S. Latino children have the highest rates of childhood obesity (25.8%), as compared to their black (22%) and white (14.1%) peers.
In Texas, 27.3% of Latino 8th graders have obesity compared to 16% of their white peers.
Obesity is associated with increased lifetime risks for numerous adverse health outcomes—mental health concerns, high blood pressure, developing diabetes, breathing problems, and developing fatty liver disease—and extra health care costs.
This conversation is not new.
However, it can be difficult for children and parents to make healthy food choices and get enough physical activity when they live and go to school in communities that do not support healthy habits.
 That’s why researchers at the Michael & Susan Dell Center for Healthy Living at The University of Texas Health Science Center in Houston (UTHealth) School of Public Health in Austin created a surveillance system to monitor obesity and contributing factors across the state, known as School Physical Activity and Nutrition (SPAN) Project.
SPAN Data Collection
With funding from the Texas Department of State Health Services (DSHS), the team collected data at four time points using a cross-sectional questionnaire.
Data collected also included information such as school transport mode, television use in bedroom, sugar sweetened beverage (SSB) consumption, and beef/pork consumption. The child’s health status, such as diabetes prevalence and painful mouth or teeth, was also considered.
SPAN data collection consists of:
- Administration of a questionnaire which assesses food choice behaviors, food selection skills, weight perceptions and practices, nutrition knowledge, attitudes about food and eating, and physical activity behaviors
- Height and weight measurements
- School environment observations including a vending machine audit, healthy signage observations
- A school-level health policy questionnaire
The SPAN survey was administered during the following four time points to the following populations:
- 2000-2002: 4th, 8th and 11th graders (15,164 students)
- 2004-2005: 4th, 8th and 11th graders (23,190 students)
- 2009-2011: 4th graders and their parents; 8th and 11th graders (14,191 students and 3,733 parents)
- 2015-2016: 2nd graders and their parents; 4th, 8th and 11th graders (15,236 students and 2,317 parents)
Researchers are continuing data collection by including a fifth time point, 2019-2020, with the intention to survey 19,900 students and 6,920 parents.
SPAN Data Explorer
The SPAN data explorer provides 13 diet-related, 12 physical activity-related and 10 health status variables.
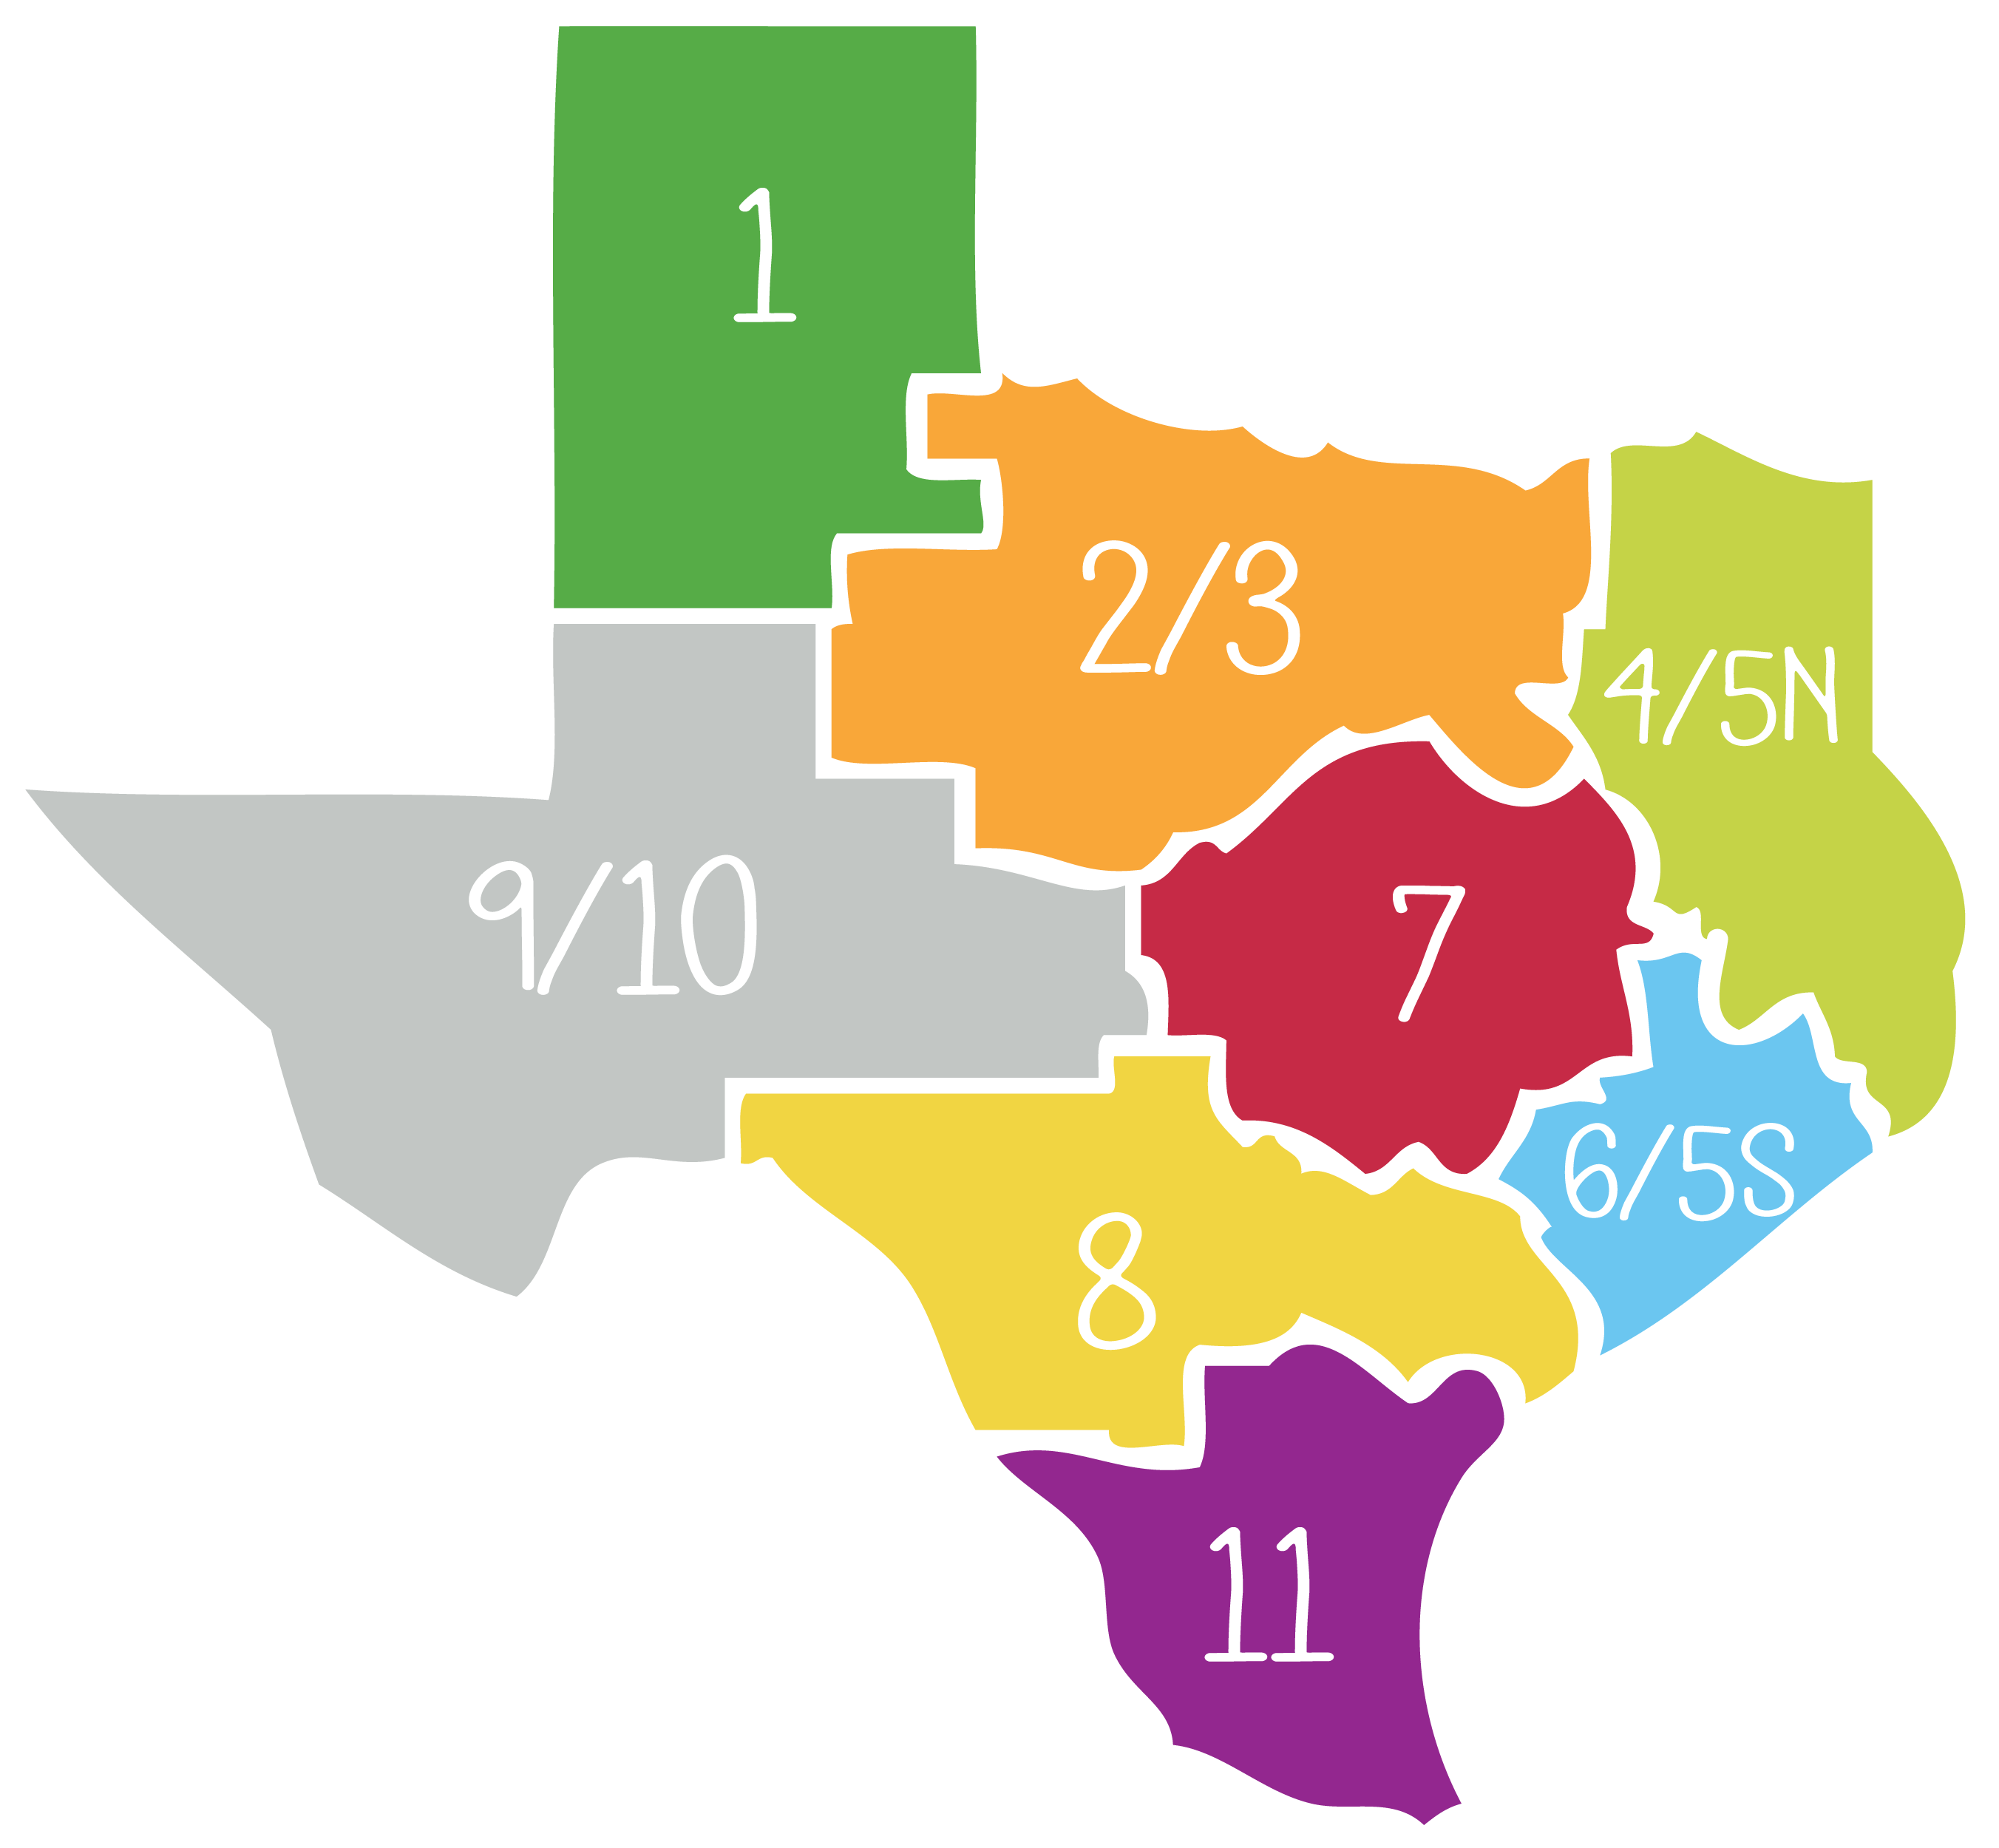
Data can be displayed for the entire state or by health service regions—see image below. Additionally, data can be displayed by race/ethnicity, border/non-border, and 2nd, 4th, 8th, and 11th grade.
Below are examples of four variables.
Sugar Sweetened Beverage (SSB) Consumption.
- Statewide, 60.7% of 8th grade students consumed at least one SSB the previous day; however, disparities can be seen by gender, ethnicity, and geographic location.
- More Latinos (64.9%) consumed one or more SSBs than their white peers (51%).
- More 8th grade students near the Texas-Mexico border (68.2%) consumed SSB the previous day than non-border students (57.3%).
- More 8th grade girls (68.7%) in Health Service Region 4/5N consumed one or more SSBs the previous day than their peers (42.9%) in Health Service Region 7.
School Transport Mode.
- Of six modes of school transport—bike, carpool, city bus, family car, school bus, and walk—disparities can be seen by gender, ethnicity, and geographic location.
- Statewide, fewer Latino students (10.7%) walk than their white peers (13.2%) and fewer girls (11%) walk than boys (14.3%).
- In Health Services Region 6/5N, 0% Latina girls ride a bike compared to 1.7% of girls statewide.
- 30.8% of students ride the bus in Health Service Regions 8 and 11, compared to the 16.4% across the state.
- In Health Service Region 7, 4% of boys take the city bus and 12.3% ride a bike compared to 0.1% of girls that take the city bus and 3.7% of girls that bike.
Diabetes Prevalence.
- Statewide, 2.4% of 11th grade students have diabetes; however, disparities can be seen by gender, ethnicity, and geographic location.
- In Health Service Region 6/5S, 3.4% of 11th graders have diabetes. More 11th grade girls (4.2%) than boys (2.6%) have diabetes in this region, compared to 1.9% of girls and 2.9% of boys statewide.
- 10.4% of 11th grade African American boys have diabetes compared to 0% of their white peers in Health Service Regions 1 and 9/10.
- In Health Service Region 7, 2.8% of Latino boys in 11th grade have diabetes compared to 0% of their white peers.
Obesity.
- Statewide, 26.7% of 4th grade students, 24.2% of 8th grade students, and 20.2% of 11th grade students have obesity; however, disparities can be seen by gender, ethnicity, and geographic location.
- Of 4th grade students, more boys (29%) are obese than girls (24.2%); more Latinos (32.2%) are obese than non-Latinos (15.8%); and more border students (30.1%) are obese than non-border students (24.6%).
- 7% of Latino boys in 11th grade have obesity compared to 21.4% of white boys.
- In Health Service Region 2/3, 30.4% of students in 8th grade have obesity compared to 19.4% students in Health Service Region 7.
- 29.8% of Latina girls in 8th grade have obesity compared to 10.6% of white girls in Health Service Region 4/5N.
- In Health Service Region 7, 24% of Latino students in 11th grade have obesity compared to 6.6% their white peers.
In addition to the interactive data explorer, you can also access one-page fact sheets by grade (2nd, 4th, 8th, and 11th) and Health Service Region.
Explore the data for yourself and spread the word to health advocates in Texas.
By The Numbers
142
Percent
Expected rise in Latino cancer cases in coming years