Share On Social!
This is part of our Sugary Drinks & Latino Kids: A Research Review »
Sugary drink consumption is responsive to changes in pricing
One recent systematic review concluded that a 10 percent increase in soft drink prices would lead to a 7.9 percent reduction in soft drink consumption.85
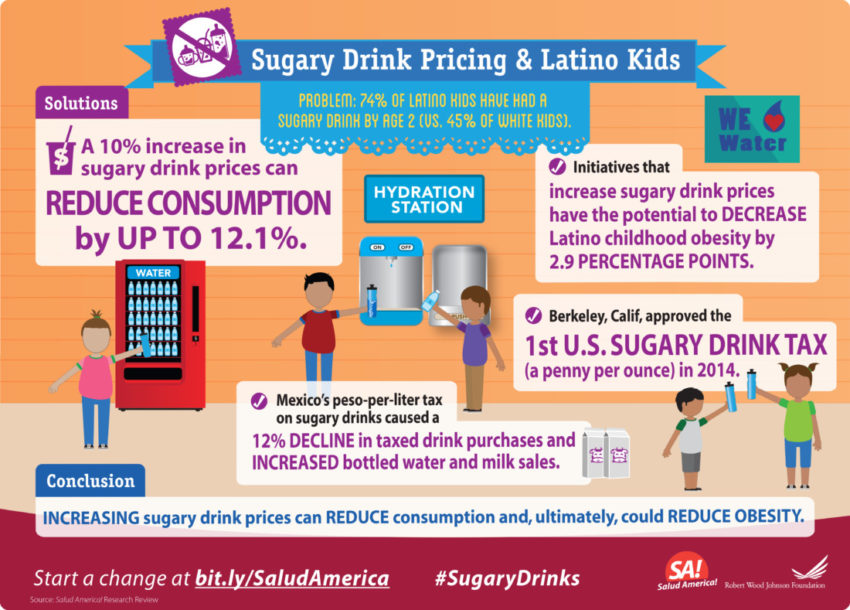
A second systematic review of studies published from January 2007 through March 2012 concluded that a 10 percent price increase for SSBs only would lead to an even larger—12.1 percent—reduction in SSB consumption, as some consumers would switch to diet, water and other lower-calorie options. Price increases on more narrowly defined categories of SSBs (e.g., regular carbonated soda) would lead to larger reductions in consumption in these categories.86
A recent randomized controlled trial conducted in the Netherlands had study participants shop in a virtual 3-D supermarket and randomized participants to two groups – an experimental condition with a simulated 19 percent price increase for SSBs and a control group with regular prices.87
Researchers examined the effect of the price conditions on the purchase of SSBs as well as four specific beverage categories and four specific snack categories.
Statistically significantly lower SSB purchases were observed in the experimental condition (a decrease of .90 L per household per week), while no significant effects were observed for purchases in other beverage or snack food categories.
A recent meta-review on the effect of fiscal policy interventions intended to improve diet examined 11 systematic reviews representing 533 individual studies, including cross sectional and longitudinal studies, modeled studies, and randomized controlled trials.86
SSBs were identified as one of the most effective targets for fiscal policy intervention, given that they are energy-dense and nutrient-poor, and that there are many healthier substitutes.
More research is needed on how pricing changes impact Latinos
While the evidence overall is convincing that increasing the price of SSBs reduces SSB consumption, there is currently a lack of evidence on the differential effects of increased SSB prices for various racial/ethnic groups, including Latinos.
One recent paper linked soda consumption data from NHANES to soda price data from the Council for Community and Economic Research and estimated differential responsiveness to price changes for different populations. The authors concluded that the weakest negative associations between soda price and intake were found among minority (including Hispanic) children and adolescents.89
Pricing of sugary drinks and impact on obesity
Aside from a reduction in consumption, little is known about the effect on obesity of pricing increases of sugary drinks.
One study used carbonated beverage prices to look at the impact of beverage prices on children’s weight, using the Early Childhood Longitudinal Study, Kindergarten Class of 1998-99 (ECLS-K) data.
This study found that higher beverage prices were associated with lower BMI as children aged from kindergarten through eighth grade.
In addition, estimates showed that the effects of beverage prices were greater for Hispanic and White children, compared with black children, and greater for near-poor children, compared with poor and non-poor children.90
Other studies also have found greater impact in low-socioeconomic status and/or minority populations, at younger ages, and for individuals at a higher weight.86
Sugary drink taxes are one strategy to curb consumption
Taxes specifically on SSBs have been proposed as one way to curb SSB consumption and possibly reduce obesity (in contrast to existing state sales taxes on beverages, which do not differentiate between sweetened and low- or no-calorie alternatives and are generally not comprehensively applied to all SSBs).
A federal SSB tax was introduced in July 2014,91 but to date, no such legislation has been passed at the state or federal level.
SSB taxes have recently been adopted in Mexico, Philadelphia, and in Berkeley, Calif.
Beginning in 2014, a peso-per-liter tax on SSBs (approximately 7 cents, or a 10% increase in price) went into effect throughout Mexico. Though not a domestic example, this case is expected to provide valuable information through its implementation and ongoing evaluation.
According to a study by Mexico’s National Institute of Public Health and the University of North Carolina, following the implementation of the tax, purchases of soda and other taxed beverages declined 6 percent on average, and reached 12 percent by December 2014.92
Sales of bottled water and other untaxed drinks (e.g., 100% juice and milk) increased 13 percent and 7 percent, respectively.93
Mexico’s sugary drinks tax is projected to prevent 190,000 cases of diabetes, 20,000 heart attacks and strokes, and 19,000 deaths among Mexicans ages 35-94 over the next 10 years, in addition to saving $1 billion in direct healthcare costs in that span, according to a 2016 study on the long-term health and economic effects of the tax.94
In November 2014, Berkeley (10.8% Latino) became the first U.S. jurisdiction to pass a tax on SSBs (a penny per ounce), in spite of nearly $2.5 million in industry spending to defeat this ballot initiative.95
In June 2016, Philadelphia became the first major U.S. city to approve a tax on sodas and other sugary drinks. The 1.5-cent-per-ounce tax, expected to go into effect on Jan. 1, 2017, is expected to raise $91 million annually and fund city projects including pre-kindergarten expansion, the creation of community schools and an investment in parks and recreation centers, according to news reports.96,97
In November 2016, sugary drink taxes were also approved in Boulder, Colo., Cook County, Ill., and San Francisco, Oakland, and Albany, Calif.98,99
Revenues from a sugary drink tax
In a recent analysis using average SSB prices collected from food stores nationwide, the anticipated change in price with a penny-per-ounce SSB tax was calculated for various beverages.
Authors estimated that a penny-per-ounce SSB tax would represent a 16.9 percent tax on SSBs overall, a 20.9 percent tax on regular soda, a 13.3 percent tax on juice drinks, a 16.7 percent tax on sports drinks, and a 4.8 percent tax on energy drinks.100
The authors projected that such a tax would result in a 20.3 percent decline in SSB consumption overall and that the drop in consumption of regular soda, juice drinks, isotonic sports drinks, and energy drinks would be 24.5 percent, 16.0 percent, 20.0 percent, and 5.8 percent, respectively.
Independent of their impact on consumption, several experts have noted that earmarking SSB tax revenues for obesity-prevention and -reduction efforts would improve weight outcomes.101
Revenue from Berkeley’s SSB tax are allocated to the city’s general fund; while not earmarked for obesity prevention and/or health promotion efforts, an appointed panel of experts in child nutrition, healthcare, and education, will make recommendations to the City Council on specific health programs to fund or establish to improve children’s health across Berkeley.
In several studies that found little or no impact of existing, small sales taxes on weight outcomes, the authors noted that their estimates suggest that more sizable taxes would have significant effects on weight outcomes at the population level.
Several studies have used the estimates from research on the effects of beverage taxes and prices on beverage consumption and weight outcomes to simulate the impact of larger beverage taxes.
One such study projected that a penny-per-ounce tax (which is about a 20 percent increase in price if fully passed on to consumers) would translate to a 24 percent decrease in SSB consumption, a reduction in current consumption from 190-200 calories per day to 145-150 calories, with projected annual revenues of $79 billion from 2010-2015.102
A recent study, noting a lower price responsiveness among adolescents compared to children and adults, estimated that a penny-per-ounce soda tax or 20 percent increase in soda price would reduce overall soda intake by 16.2 percent for children, 10.4 percent for adolescents and 13.2 percent for adults.103
Finally, a recent micro-simulation analysis estimating the impact of a penny-per-ounce SSB excise tax on childhood obesity prevalence concluded that by 2032, such a tax would reduce obesity by 1.6 percentage points among 6-12-year-olds and 2.4 percentage points among 13-18-years-olds.104
The estimated reductions in obesity prevalence were higher among Latino children (-2.0%) and teens (-2.9%) in this study.
More from our Sugary Drinks & Latino Kids: A Research Review »
- Introduction & Methods
- Key Research Finding: Latino kids’ sugary drink consumption
- Key Research Finding: Weight gain
- Key Research Finding: Marketing
- Key Research Finding: Childcare settings
- Key Research Finding: Pricing (this section)
- Key Research Finding: Water
- Policy Implications
- Future Research Needs
References for this section »
85. Andreyeva, T., Long, M. W. & Brownell, K. D. The Impact of Food Prices on Consumption: A Systematic Review of Research on the Price Elasticity of Demand for Food. Am J Public Health 100, 216–222 (2010).
86. Powell, L. M., Chriqui, J. F., Khan, T., Wada, R. & Chaloupka, F. J. Assessing the potential effectiveness of food and beverage taxes and subsidies for improving public health: a systematic review of prices, demand and body weight outcomes. Obes Rev 14, 110–128 (2013).
87. Waterlander, W. E., Ni Mhurchu, C. & Steenhuis, I. H. M. Effects of a price increase on purchases of sugar sweetened beverages. Results from a randomized controlled trial. 32–39 (2014).
88. Thow AM & Downs S. Fiscal policy options with potential for improving diets for the prevention of noncommunicable diseases (NCDs). (Geneva: World Health Organization, 2016).
89. Wada, R., Han, E. & Powell, L. M. Associations between soda prices and intake: Evidence from 24-h dietary recall data. 54–60 (2015).
90. Wendt, M. & Todd, J. E. The effect of food and beverage prices on children’s weights. (USDA Economic Research Service).
91. DeLauro Introduces Bill to Tackle Dual Epidemics of Diabetes, Obesity. Available at: http://delauro.house.gov/index.php?option=com_content&view=article&id=1867:delauro-introduces-bill-to-tackle-dual-epidemics-of-diabetes-obesity&catid=2&Itemid=21. (Accessed: 7th September 2016)
92. Alianza por la Salud Alimentari. Mexico’s National Institute of Public Health study indicates the federal sugar-sweetened beverage tax is successfully reducing purchases in Mexican households. (2015). Available at: http://alianzasalud.org.mx/2015/06/mexicos-national-institute-of-public-health-study-indicates-the-federal-sugar-sweetened-beverage-tax-is-successfully-reducing-purchases-in-mexican-households/. (Accessed: 23rd August 2016)
93. Replogle, J. In Mexico, People Drinking Less Soda After New Tax | State of Health | KQED News. State of Health (2014). Available at: https://ww2.kqed.org/stateofhealth/2014/12/02/in-mexico-people-drinking-less-soda-after-new-tax/. (Accessed: 7th October 2016)
94. Sánchez-Romero, L. M. et al. Projected Impact of Mexico’s Sugar-Sweetened Beverage Tax Policy on Diabetes and Cardiovascular Disease: A Modeling Study. PLOS Medicine 13, e1002158 (2016).
95. Ferdman, R. How the soda industry met its match in one of America’s most liberal cities – The Washington Post. (2014).
96. Burke, M. Philadelphia becomes first major city to pass soda tax. USA TODAY (2016). Available at: http://www.usatoday.com/story/news/2016/06/16/philadelphia-becomes-first-major-city-pass-soda-tax/85999128/. (Accessed: 7th October 2016)
97. Ellis, L. Breaking News!: Major Victory for Philadelphia, 1st Major US City to Approve Sugary Drink Tax!! Community Commons (2016). Available at: http://www.communitycommons.org/groups/salud-america/changes/update-soda-tax-discussions-bubble-up-in-philly-2/. (Accessed: 7th October 2016)
98. Ellis, L. & Salud America! Breaking News: Four Cities All Vote in Favor of Soda Tax. Community Commons (2016). Available at: http://www.communitycommons.org/groups/salud-america/changes/breaking-news-four-cities-all-vote-in-favor-of-soda-tax/. (Accessed: 17th November 2016)
99. Ellis, L. & Salud America! Cook County Approves Soda Tax! Community Commons (2016). Available at: http://www.communitycommons.org/groups/salud-america/changes/cook-county-approves-soda-tax/. (Accessed: 17th November 2016)
100. Powell, L, Isgor, Z., Rimkus, L. & Chaloupka, F. Sugar-Sweetened Beverage Prices. (Institute for Health Research and Policy, 2014).
101. Brownell, K. D. et al. The Public Health and Economic Benefits of Taxing Sugar-Sweetened Beverages. New England Journal of Medicine 361, 1599–1605 (2009).
102. Andreyeva, T., Chaloupka, F. J. & Brownell, K. D. Estimating the potential of taxes on sugar-sweetened beverages to reduce consumption and generate revenue. Preventive Medicine 52, 413–416 (2011).
103. Wada, R., Han, E. & Powell, L. M. Associations between soda prices and intake: Evidence from 24-h dietary recall data. 54–60 (2015).
104. Kristensen, A. H. et al. Reducing Childhood Obesity through U.S. Federal Policy. American Journal of Preventive Medicine 47, 604–612 (2014).
By The Numbers
1
Supermarket
for every Latino neighborhood, compared to 3 for every non-Latino neighborhood