
Share On Social!
Data can drive action for healthy change.
But what if we don’t have enough data? Or the right data? Or equitable data?
Unfortunately, even with more health reports and more health dashboards than ever before, we still face inconsistent and incomplete data.
We are lacking sufficient data – especially data disaggregated by race/ethnicity – on social determinants of health, firearm violence, traffic crashes, and adverse childhood experiences.
Insufficient data happens for many reasons. Limited funding, limited staff, uncertain methods, logistical challenges, entrenched practices, inadequate analysis, and inadequate or non-uniform reporting after data collection are occurring at the local, state, and federal levels.
Let’s explore the most critical missing data and how health advocates can fill the gaps and promote better data collection.
Insufficient Data: Social Determinants of Health
Public health action requires data collection to define and monitor the problem and then to identify risk and protective factors.
That isn’t happening when it comes to the social determinants of health (SDoH).
You can think of SDoH – the non-medical factors that impact our health – in five broad categories: economic stability, education access and quality, health care access and quality, neighborhood and built environment, and social and community context.
Or you can think of SDoH in specific examples: affordable housing, transportation options, quality schools, job opportunities, livable wages, healthy food, safe parks, air and water quality, racism and discrimination, and violence.
Inequities in SDoH result in inequities in social, economic, and health outcomes.
Yet there are zero comprehensive, complete national sources for SDoH-related data.
2024 UPDATE: There have been slow improvements in SDoH data collection through the Behavioral Risk Factor Surveillance System, to include 39 states, the District of Columbia, and two US territories using the Social Determinant of Health and Health Equity (SDOH/HE) Module in 2022. This is up from 17 states in 2017, the only other year the module was available. As explained below, the Behavioral Risk Factor Surveillance System (BRFSS) is an annual survey that gathers information about health, health risk behaviors, preventive practices, and health care access from more than 400,000 adults aged 18 and older. Each state has the option to include additional questions through BRFSS optional modules or state-added questions. The social determinants of health module is optional.
Instead, we have fragmented, piecemeal data collection and data sources for some SDoH-related data, like separate surveys about housing, transportation, and food access.
Many of these fragmented sources are inadequate from a public health perspective, largely due to irrelevant performance measures and failure to identify, operationalize, and track progress toward meaningful goals.
State and federal agencies, like the Federal Highway Administration, for example, are required to show efficient and effective use of public funds to provide goods and services to improve the lives of Americans.
Yet, to assess transportation performance, state departments of transportation are required to measure pavement and bridge conditions, travel time reliability, peak hours excessive delay, emissions, and safety.
These metrics are inadequate to evaluate if transportation investments are improving quality of life.
Regardless of the status of these metrics, working Americans might be skipping trips to essential resources and services, foregoing education and employment opportunities, or foregoing spending on food, medications, and other essentials because they are financially burdened by private vehicle ownership or they lack quality transit service.
Conducted by the Federal Highway Administration, the National Household Transportation Survey (NHTS) is the nation’s leading source of travel behavior data. But it fails to collect data on transportation cost burden, foregone trips, and other symptoms, tradeoffs, and consequences of inadequate, unsafe, and unreliable transportation that could negatively impact social, economic, and health outcomes.
Thus, it tells us nothing about the extent to which transportation investment helps or hinders quality of life in America thus is not helpful as a source of SDoH-related data.
Beyond—but excluding—transportation, one national resource regarding recommendations for SDoH data is the PhenX Measures for SDoH Collection.
In 2018, the National Institute on Minority Health and Health Disparities (NIHMD) launched 19 measurement protocols for the collection of comparable data on SDoH across studies, and in 2022, they added 15 new protocols.
The purpose of these protocols is to create common data elements to make it easier for investigators across the country to compare or combine data from different studies.
The following SDoH measures are included in the PhenX Measures for SDoH Collections:
- Job Insecurity (two items)
- State Minimum Wage (instructions for calculating)
- Housing Instability Due to Affordability (two items)
- Perceptions of Housing Insecurity (two items)
- Food Insecurity (six items)
- Food Swamp (instructions for calculating)
- Neighborhood Walking and Biking Environment (15 items and instructions for calculating)
- Concentrated Poverty (instructions for calculating)
- Residential Concentrations of Income (instructions for calculating)
- Race/Ethnic Residential Segregation -American Community Survey (instructions for calculating)
- Social Vulnerability Index (instructions for calculating)
- Environmental Justice Screening and Mapping Tool (11 items)
While this collection will be helpful to advance knowledge on SDoH, there are limitations.
For example, the PhenX collection fails to include protocols regarding firearm violence, traffic safety, adverse childhood experiences (ACEs), or any other transportation-related measures.
It is unclear if uncertain methods, logistical challenges, entrenched practices, or misinformation hindered the inclusion of other key SDoH in this data harmonization effort.
One potential new source for SDoH data is the Medical Expenditure Panel Survey (MEPS), which recently included a Social and Health Experiences Questionnaire that asks about housing quality, neighborhood characteristics, transportation issues, food security, financial strain, experiences of physical and social violence, and ACEs.
While MEPS goes above and beyond some PhenX Measures, it failed to include others. Thus, these findings will not be comparable across studies.
One important transportation-related question included in the new MEPS questionnaire is, “In the past 12 months, has lack of reliable transportation kept you from medical appointments, meetings, work, or from getting things needed for daily living?”
This question is common among rising SDoH screening tools, for which the better protocols provide the following responses options:
- “Yes, it has kept me from medical appointments or from getting my medications”
- “Yes, it has kept me from non-medical meetings, appointments, work, or from getting things that I need”
- “No”
Although focused more on social needs rather than social determinants, there is a screening tool comparison table from the Social Intervention Research & Evaluation Network (SIREN) at the University of San Francisco California that compiles the content of several of the most widely used social health screen tools.
While a growing number of hospitals and physicians are screening patients for SDoH and we need health advocates to push for even more SDoH screening, we need a more comprehensive national approach to SDoH data collection.
After all, quality data is important to understand and make decisions about problems.
Insufficient Data: Transportation as a Social Determinant of Health
One major weakness across all SDoH data collection and harmonization efforts is lack of consideration of transportation as a determinant of health.
Although several elements of transportation impact health – including affordability, safety, and access to employment, food, medical care, and other essential resources and services – data is lacking about how transportation intersects with these elements.
Moreover, guidance for data collection or recommendations to improve data collection on transportation is lacking.
Without adequate transportation data, we are telling an unclear picture of unmet transportation needs and thus telling an unclear picture of SDoH.
Like food security, housing security, and energy security, we need to measure transportation security and establish it as a metric in SDoH-related data collection and in transportation decision-making.
Insufficient Data: Firearm Violence
Firearm violence is a leading cause of death among children ages 0-19.
But data collection on firearm violence is lacking.
In 2019, nine children ages 1-17 are killed with guns each day in the U.S., according to the Children’s Defense Fund.
While these data help define and monitor the problem, we need better data to identify risk and protective factors.
Two reasons we lack data on firearm violence are due to Congress removing funding from the Centers for Disease Control and Prevention (CDC) for firearm injury research and due to Congress adding a provision to annual federal spending bills, known as the Dickey Amendment, that prohibits the use of federal funds to advocate or promote gun control.
“Precisely what was or was not permitted under the clause was unclear,” according to the American Psychological Association. “But no federal employee was willing to risk his or her career or the agency’s funding to find out.”
Thus, the federal government spends only $57 per gun death on research compared to $1,740 per heart disease death, $2,996 per cancer death, and $6,556 per lung disease death, according to a gun violence fact sheet from Giffords Law Center.
Additionally, local law enforcement agencies are not required to submit specific crime data to the federal National Incident-Based Reporting System (NIBRS) or the Unform Crime Report (UCR) Program.
Thus, important contextual information is often missing, which hinders efforts understand and address risk factors of violence gun violence.
For example, in 49% of murder and nonnegligent manslaughter incidents in 2019, the relationship between murder victims and offenders was unknown, according to the FBI’s UCR Program.
To prevent these gruesome deaths, particularly among children, we need better data on gun violence.
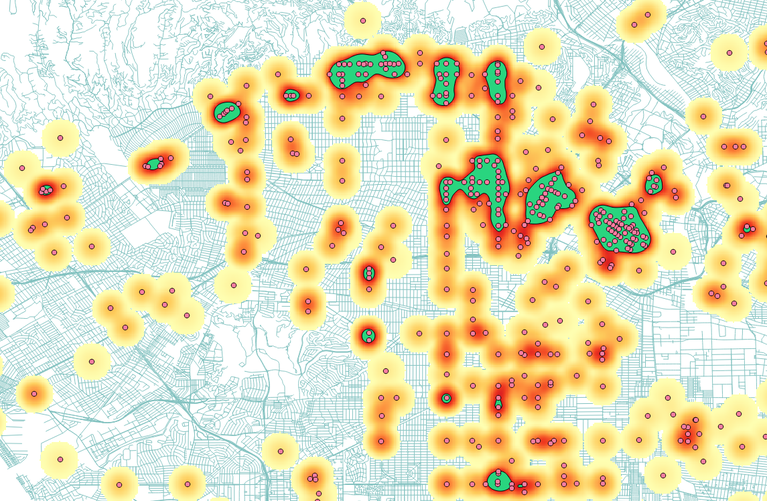
Insufficient Data: Traffic Crashes
Traffic crashes are a leading cause of death among children ages 0-19 – but data is lacking. In traffic fatality reports, important contextual information is not collected thus unknown.
Traffic crash and fatality data is collected and maintained at the local, state, and national levels in a variety of databases.
However, there is little in the way of federal legislation regarding the scope and extent of data collection.
Guidelines regarding traffic crash data collection are voluntary. These voluntary guidelines include the Model Minimum Uniform Crash Criteria (MMUCC) and Model Inventory of Roadway Elements (MIRE) and have many limitations from a public health approach to injury prevention because they fail to consider necessary data to identify risk and protective factors of traffic crashes.
Thus, local law enforcement agencies are not collecting sufficient crash data.
For example, they are not collecting data on the speed of the vehicle, 85th percentile speed, width of lanes, presence/type of bicycle facility, road design characteristics, and the size and weight of the vehicle(s) involved.
Because there are differences in the frequency and severity of crashes among SUVs and pickup trucks, crash data reporting guidance should consider new classifications for motor vehicle body type categories that considers the height of the vehicle beyond merely the body type.
“Federal safety regulators have known for years that SUVs, with their higher front-end profile, are at least twice as likely as cars to kill the walkers, joggers and children they hit, yet have done little to reduce deaths or publicize the danger,” according to an investigation by the Detroit Free Press/USA TODAY.
Because there are also differences in the frequency and severity of crashes among vehicles less than 10,000 pounds, crash data reporting guidance must consider new classifications for vehicle weight rating that considers the weight of the vehicle beyond merely less than 10,000 lbs.
Averages across current vehicle body type and vehicle weight categories mask important differences within categories thus hinder efforts to identify dangerous vehicle design characteristics.
Although the Federal Motor Carrier Safety Administration (FMCSA) only analyzes crashes involving vehicles greater than 10,000 pounds, MMUCC should consider risk factors related to vehicle weight among vehicles less than 10,000 pounds.
This lack of contextual data is evident through the Fatality Analysis Reporting System (FARS), which is the primary national source of traffic fatality data.
NHTSA developed the Crash Data Improvement Program (CDIP) to examine the quality of State’s crash data and provide States with guidance and recommendations to improve data to support safety decisions.
However, if certain data elements are not required, they will not be captured in this process. In other words, CDIP is limited by the poor quality of the voluntary reporting guidelines.
Quality data is important to understand and make decisions about problems, problems like traffic deaths. According to the National Highway Traffic Safety Administration (NHTSA):
- Law enforcement officials use crash data to determine when and where to conduct data-driven enforcement.
- Highway safety offices use crash data to direct highway safety funding, evaluate programs, and develop strategic communication campaigns.
- Engineers use crash data to screen networks, diagnose trends, and select and prioritize countermeasures and evaluate implemented changes.
- Researchers use crash data to identify crash patterns and evaluate new countermeasures.
- Legislators use crash data to prioritize program implementation and draft new or modified data-driven legislation.
Insufficient requirements regarding traffic crash data collection results in an inadequate understanding about risk factors thus inadequate countermeasures.
“Data gaps degrade our understanding of the places, people, vehicles, and contributing factors involved in crashes,” according to the National Highway Traffic Safety Administration (NHTSA) Traffic Records Program Assessment Advisory 2018 Edition.
Protecting American kids and youth from violent deaths starts with data collection, particularly data on risk factors, such as road design factors and the size and weight of the vehicles involved in the crash.
Insufficient Data: Adverse Childhood Experiences
Adverse childhood experiences (ACEs), like abuse and neglect, are a root cause of many of today’s critical public health challenges, including toxic stress.
Yet data collection efforts on ACEs and toxic stress are lacking.
There have been slow improvements in ACEs data through the Behavioral Risk Factor Surveillance System. The Behavioral Risk Factor Surveillance System (BRFSS) is an annual survey that gathers information about health, health risk behaviors, preventive practices, and health care access from adults aged 18 and older.
BRFSS completes more than 400,000 adult interviews each year across all 50 states and the District of Columbia.
All states must ask fixed core questions which remain the same every year and rotating core questions that are asked every other year.
Each state has the option to include additional questions through BRFSS optional modules or state-added questions.
BRFSS optional modules include the Adverse Childhood Experiences Module.
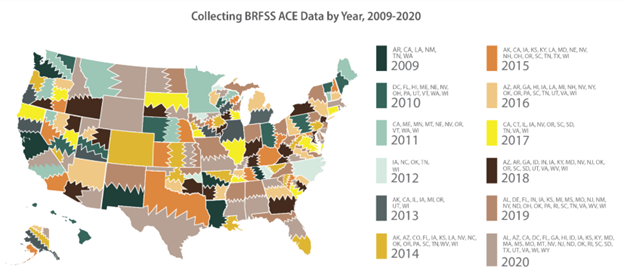
The Adverse Childhood Experiences Module was first used in 2009 by Arkansas, California, Louisiana, New Mexico, Tennessee, and Washington.
Since 2009, 48 states plus the District of Columbia have included the ACEs Module for at least one year on their BRFSS.
This is progress.
However, only 10 states have included the ACEs module more than 5 times in the last 13 years.
And, again, BRFSS data is only available at the state level except in 198 metropolitan statistical areas and 224 counties; however, not all data are available at the local level.
BRFSS also has a Firearm Safety Module, which was first used in the fixed core questions in 2004 but was retired until it became an optional module in 2017. Six states used the Firearm Safety Module in 2017.
One of the firearm questions in BRFSS module asks if any firearms are kept in or around the home.
Data show that homicide is three times more likely if there is a gun in the home, according to The State of America’s Children 2021: Gun Violence released by the Children’s Defense Fund.
This demonstrates again why data are so important.
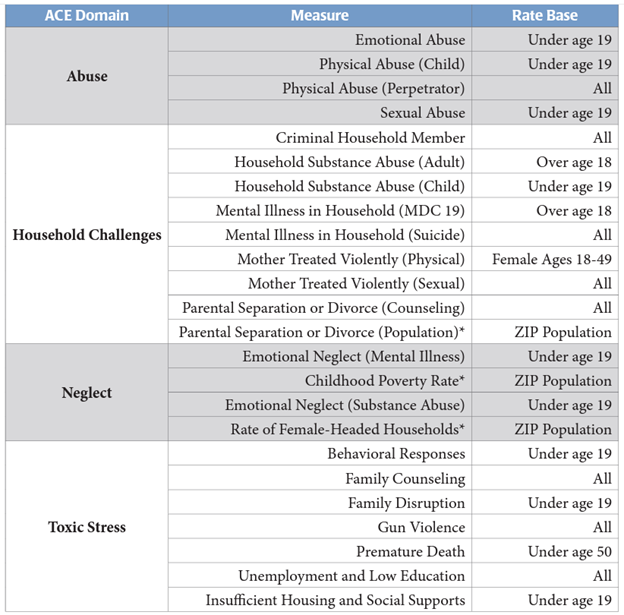
Regarding ACEs, in 2016, the Missouri Hospital Association aggregated hospital and emergency department data in Missouri and Kansas and attributed the diagnostic codes to one of four ACE-related domains: abuse, neglect, household challenges, and toxic stress.
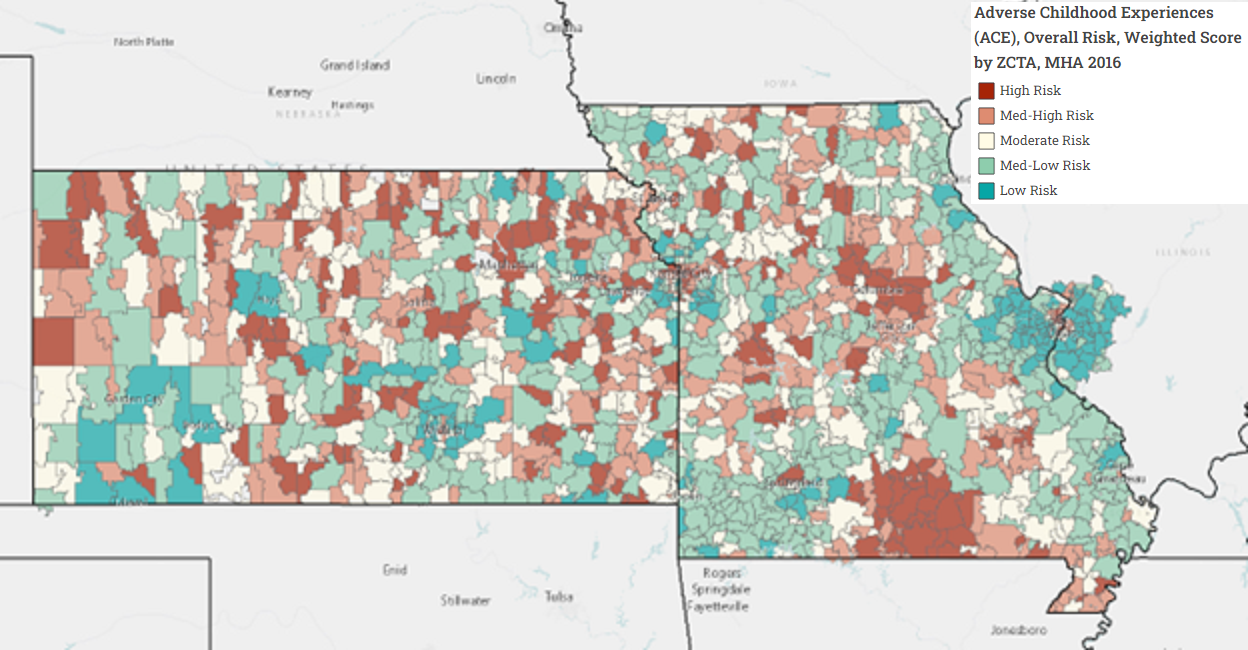
They reported the ACE-risk score for zip codes across the two states to identify high-risk areas.
In 2020, California began reimbursing physicians to screen Medicaid patients for ACEs.
While this is an important step to help define and monitor the problem, we need more comprehensive ACEs data collection efforts.
How Can We Advocate for More Sufficient Data Collection?
Incomplete and insufficient data are preventing a comprehensive response to inequities in the social determinants of health, transportation, firearm violence, traffic crashes, ACEs, and more.
Public health advocates can push for more equitable data collection in three ways:
- Raise awareness about and continuously draw attention to insufficient data
- Build a relationship with state coordinators for data collection, such as BRFSS coordinators and traffic records coordinators
- Get involved in the Notice of Proposed Rulemaking process
1. For Better Data, Raise Awareness About Insufficient Data
In all public health, advocacy, and policy communications, we need to raise awareness about insufficient data.
Develop language to include in all reports, news briefs, and social media outreach that draws attention to lacking data. This could be one or two sentences stating limited understanding of the topic due to limited data.
For example, consider data on zero vehicles per household, which is a common indicator of low transportation access to opportunity, thus is often used as a proxy to determine low access to opportunity.
However, it is important to note that while zero vehicles per households helps identify low transportation access households, it is an inaccurate indicator transportation access for all other households.
It would be misleading to suggest that households with one or more vehicles have better transportation access without understanding how many adults live in the household.
However, this data is often not available.
Thus, when reporting on transportation access, authors often conclude that zero-vehicle households have low access and all other households have high access, despite that some households may have one vehicle and two adults or one vehicle and three adults.
Without data on adults per vehicle per household, zero vehicles per household leads to incorrect assumptions about transportation access.
To this point, when summarizing data about zero vehicle households, you should state something like this, “Households with fewer than one vehicle per adult per household would be a better indicator of transportation access than households with zero vehicles; however, these data are not available.”
Another example regarding vehicles could be to report risk factors for fatal motor vehicle crashes with the following disclaimer: “There are differences in the frequency and severity of crashes among different vehicle body types, thus the size and weight of the vehicle are also important risk factors for fatal motor vehicle crashes; however, these data are not available.”
Another example regarding transportation safety could be to include the following disclaimer when reporting speeding as a risk factor for fata motor vehicle crashes: “A driver does not have to be speeding to be going an unsafe speed, thus the posted speed limit and 85th percentile speed limit are also important risk factors fatal motor vehicle crashes; however, these data are not available.”
Another example regarding transportation access could be to report ½-mile proximity to transit with the following disclaimer, “Proximity to frequent transit (15 minutes or better) would be a better indicator of transit access than merely proximity to transit; however, these data are not available.”
Neglecting to mention lacking data could lead readers to draw incorrect conclusions about the topic because they don’t know what they don’t know and can only draw conclusions based on the information provided to them.
2. For Better Data, Engage State Data Coordinators
To advocate for better data collection, you can build a relationship with your state data coordinators.
Coordinators can include BRFSS coordinators and traffic records coordinators, as well as state governing entities that oversee various data collection efforts, such as state boards of health and State Traffic Records Coordinating Committees.
Identify BRFSS coordinators and members of the board of health in your state and urge them to include the ACEs Module and Firearm Safety Module more frequently – or permanently – in the BRFSS survey.
Not all states have a board of health, but you can search it in Google.
You can also urge them to consider SDoH questions, such as the transportation screening question mentioned above, in their state-added questions.
To advocate for better data collection, you can also build a relationship with state traffic records coordinators and the Traffic Records Coordinating Committee that advises and oversees traffic safety.
For states to receive federal Traffic Safety Information System grants , states must establish a State Traffic Records Coordinating Committee and a designated traffic records coordinator.
The State Traffic Records Coordinating Committee (TRCC) is tasked with the following:
- Provide the leadership and coordination necessary to develop, implement, and monitor the State Traffic Records Strategic Plan;
- Influence agency policy decisions that impact the State’s traffic records system;
- Advise the SHSO regarding the allocation of Federal funding as appropriate;
- Identify performance measures and monitors progress;
- Serve as a forum for the discussion of the State’s traffic records investments and challenges; and
- Provide meaningful coordination among stakeholders.
To reduce duplication of efforts, the State Traffic Records Coordinating Committee strategic planning should be incorporated into other congressionally mandated strategic planning documents, such as the Highway Safety Plan, the Strategic Highway Safety Plan, and the Commercial Vehicle Safety Plan.
Although states are required by law to develop a Strategic Highway Safety Plan that uses crash data to identify risk factors, there are few requirements regarding what crash data is collected.
You can urge traffic records coordinators to require better data collection guidance and requirements for police accident reports, to include more contextual information such as the speed of the vehicle, 85th percentile speed, width of lanes, presence/type of bicycle facility, road design characteristics, and the size and weight of the vehicle(s) involved.
3. For Better Data, Participate in the Rulemaking Process
Many people think Congress passes laws for federal regulation.
But federal agencies, such as the Department of Transportation, Department of Housing and Urban Development, and Department of Health and Human Service, are the main entities that control the rulemaking process for federal regulation.
Rather, Congress passes the laws that authorize federal agencies to research, analyze, and determine the final details of rules and regulations. Sometimes these laws dictate broad areas a federal agency has jurisdiction to regulate and sometimes these laws dictate specific topics a federal agency must regulate.
For example, through authority from Congress and the rulemaking process, the Department of Transportation has jurisdiction to regulate “requirements for the development, implementation, and evaluation of a highway safety improvement program (HSIP) in each State,” according to 23 CFR part 924.
With control over the rulemaking process for federal regulation, federal agencies frequently propose new or altered rules, and they are required to collect public comment on these proposals.
Public input on these rules is critical because it gives federal officials information about the potential impact of a proposed regulation, according to Unidos US. Participating in the rulemaking process allows you or your organization to shape federal programs.
You can visit regulations.gov to see what proposals are seeking your comment.
Agencies are required to publish a “Regulatory Plan” once a year in the fall and an “agenda of Regulatory and Deregulatory Actions” in the spring and fall, according to A Guide to the Rulemaking Process from the Office of the Federal Register.
These are often referred to as the “Unified Agenda.”
Viewing the Unified Agenda helps you find that the Department of Transportation, for example, will propose rulemaking in April 2023 to “update the HSIP regulations under 23 CFR part 924 to incorporate the Safe System approach, clarify the scope of the HSIP to focus on the safety of all road users on the entire public roads network, improve evaluation practices and data collection, and streamline reporting.”
This rulemaking will be particularly relevant to improve data collection on social determinants of health.
In September 2022, the Department of Transportation rulemaking revised uniform procedures implementing State highway safety grant programs and was opened for public comment for six weeks. In that time, Vision Zero Network submitted the following comment.
“Moving forward, NHTSA should adopt a public health-based, harm reduction approach to its efforts. This includes greater focus on proactive, preventative strategies to improve safety in the systems in which people move about, including stronger safety regulations on vehicles. NHTSA could do more to propel the goal of “Safer People” by catching up w/ European Union standards of its [New Car Assessment Program (NCAP)] program and regulating vehicle size/weight and safety features, such as alcohol interlocks and pedestrian/bicycle detection systems, especially focused on improving safety for those outside vehicles.”
Keeping up with the Unified Agenda will help you anticipate and schedule upcoming proposals to ensure you are able to participate.
Check out the Fall 2022 rule lists for the following agencies:
Salud America! at UT Health San Antonio frequently provides model comments for members to submit to federal rule proposals, such as changes to crash data reporting guidance, vehicle safety ratings, transportation engineering guidance, WIC, SNAP, school meals, and more.
Pursue Healthy Changes
The problem of insufficient data isn’t going away soon. Neither are health inequities.
So, while not a perfect data dashboard, we invite you to use the Salud America! Health Equity Report Card to start examining your community and where the health equity issues are.
The Health Equity Report Card, first launched in 2017 and updated in 2023, auto-generates Latino-focused and local data with interactive maps and comparative gauges, which can help you visualize and explore inequities in housing, transit, poverty, health care, food, and education.
You will see how your county stacks up in these health equity issues — now including social vulnerability and COVID-19 — compared to your state and the nation.
Then you can share the Report Card with your local leaders to advocate for healthy change!
Get your Health Equity Report Card!
By The Numbers
27
percent
of Latinos rely on public transit (compared to 14% of whites).