Share On Social!
Gun violence and traffic crashes may seem like unpredictable events.
But they are not random. They are systematic.
Data reveal trends and patterns in gun violence and traffic crashes that can help us identify risk factors and protective factors. This is especially important for addressing violent child deaths.
So what do the data show?
Join Salud America! as we explore data on risk factors as part of our four-part series on violent child death. Read the Series Overview and Part 1.
Nothing is as Random as You Think
Very little is random when it comes to our health and length of life.
Rather, trends in health outcomes point to various individual, social, and environmental factors that either contribute to or safeguard against health-related problems.
Although often not conscious of it, our surroundings have a great deal of influence on our decisions and our health.
Behavioral research suggests that individuals are not as rational as they’d like to think. People are systemically prone to making certain errors/mistakes, even regarding decisions that affect their health and wellbeing. The very definition of systemic means these decisions and mistakes are not random. Because they are not random, social scientists can study them.
Factors that contribute to health-related problems are known as risk factors.
For example, consider involvement in the criminal justice system. Environmental risk factors include segregation; social risk factors include poverty; and individual risk factors include family violence.
Factors that safeguard against health-related problems are known as protective factors.
Again, consider involvement in the criminal justice system. Social protective factors include stable housing and access to opportunity, and individual protective factors include conflict resolution skills and parental supervision.
Public health leaders craft strategies to address health issues based on risk and protective factors.
For example, it isn’t random that work-related health problems, maternal and infant mortality, smoking-related deaths, and infectious diseases like typhoid and cholera have declined rapidly in the last century.
Risk factors and protective factors were identified, and public health strategies were developed. Many of these strategies spawned federal and state policies to make working conditions safer, make hospital rooms safer, reduce exposure to environmental tobacco smoke, and improve water and sanitation.
Currently, there is enough data to identify some risk factors and protective factors to develop and advocate for public health strategies to prevent violent child deaths and injuries from motor vehicles and firearms – events that might seem random at first glance.
Why Traffic Crashes Aren’t Random
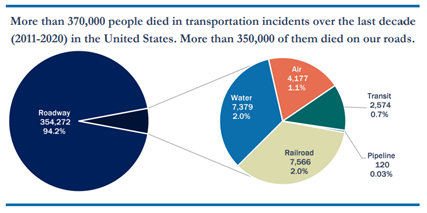
From 2011 to 2020, nearly 95% percent of the more than 370,000 transportation deaths occurred on roadways, with the rest on railroads, waters, air, transit, and pipelines, according to the National Roadway Safety Strategy from the U.S. Department of Transportation.
If railroad, water, air, or transit had this safety record, they would be shut down immediately.
Traffic crash deaths declined consistently since 1975 to 2010.
This is due in large part to concerted – not random – efforts to regulate vehicle safety. Like shatter-proof glass, collapsible steering columns, anti-lock brakes, fuel tank installation, securing of fuel lines, air bags, child safety restraints, and crumple zones.
CDC called this effort a 20th century public health achievement.
But traffic crash deaths leveled off from 2010-2019. Now traffic crash deaths spiked in 2020. In 2022, the U.S. Department of Transportation recognized traffic deaths as an urgent national crisis.
What risk factors are causing the rise?
Risk Factors for Fatal Motor Vehicle Crashes
More Americans died in traffic crashes in 2021 than any other year since 2005.
These deaths are not random. There are social/environmental and individual risk factors behind these deaths.
Social/environmental risk factors include road design (type of road and number of lanes), posted speed limits, dark lighting conditions, and vehicle design (size, weight, power, and height/style of bumper/hood).
The three main individual risk factors for fatal traffic crashes are not wearing seat belts, driving while impaired from alcohol, and speeding, according to the National Roadway Safety Strategy.
It is important to note that two of these individual risk factors, driving while impaired from alcohol and speeding, threaten the safety of all road users, not just the individual drivers.
It is also important to note that there is a difference between speed and speeding.
Risk Factors for Fatal Motor Vehicle Crashes: Speed
A pedestrian struck by a person driving 32 mph has a 25% risk of death. A pedestrian struck by a person driving 42 mph has 50% risk of death, according to a study by the AAA Foundation for Traffic Safety.
However, the data are problematic because it was based on people ages 15 and older (thus excluding children) and car and truck models from 1989-1999 (thus excluding the expanding size and weight and vehicles since 1999).
This means the risk of severe pedestrian injury and death in relation to impact speed is grossly underestimated for children and for all adults on the road today.
Thus, speed, regardless of speeding, is a risk factor for traffic violence.
Which leads us to the question, what are risk factors for speed?
The posted speed limit is a risk factor for speed.
For example, 78% of the vehicles involved in fatal pedestrian crashes were on a roadway with a speed limit greater than 30 mph, according to the National Roadway Safety Strategy. Observing the 45 mph speed limits stills puts people walking at over 50% chance of death if struck.
Drivers traveling at higher speeds, even within the legal speed limit, have a narrower field of vision. They also travel further before they can react and have longer braking distance.
Moreover, crashes at higher speeds are more forceful, thus more deadly, particularly crashes involving larger vehicles that are heavier and taller. Learn more about how speed kills here.
The Highway Safety Manual reports that a 1 mph reduction in operating speeds can result in a 17% decrease in fatal crashes.
However, reducing the posted speed limit isn’t enough to reduce operating speeds. Also, it is difficult for cities to reduce the posted speed limit due to bureaucratic limitations. The current percentile-based method for determining posted speed limits on city streets are based on antiquated practices from two-lane highways in rural areas in the mid-1900s.
This method is known as the 85th percentile speed.
One problem with this method is it assumes that most drivers will operate their vehicle at a speed that is safe and reasonable.
Although speeding is one of the top three risk factors for traffic deaths, the methods used to determine speed limits is based on the assumption that people won’t speed.
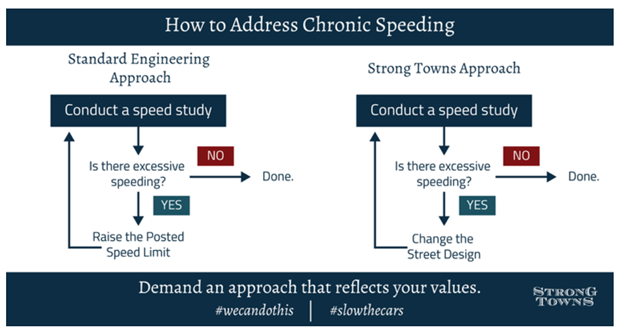
Worse, if 85% of drivers do speed, the determination will be to raise the posted speed limit.
Rather than consider traffic-calming measures or design changes to slow drivers, this method encourages higher posted speed limits over time.
This method is a risk factor for traffic deaths and injuries because it rewards speeding and results in increased speeds.
A 2016 study from the Insurance Institute for Highway Safety found that “a 5 mph increase in the maximum state speed [from 1993 to 2017] was associated with an 8.5% increase in fatality rates on interstates/freeways and a 2.8% increase on other roads.”
Many safety advocates, like Strong Towns, question the trade-off between a few minutes of saved travel time and the increased risk of traffic fatalities.
They call for changing the street design to slow the cars rather than raise the posted speed limit, and they explain why safety and speed are incompatible goals and why safety should be prioritized over speed.
Beyond methods for determining the posted speed limit, the standards used to make roadway design and engineering decisions are also risk factors for traffic deaths because they impact driver speed.
Risk Factors for Fatal Motor Vehicle Crashes: Road Design
Transportation engineers have developed highway design standards to reduce the risk and severity of traffic crashes.
These include wide lanes, wide shoulders, gentle slopes, sweeping curves, and clear zones free of fixed objects, such as trees, light poles, and parked cars.
This concept is known as forgiving design.
If you picture this highway now, you will probably feel safe going 80 mph because you sense the forgiveness and perceive the risk of driving fast to be low.
After all, everyone assumes some degree of risk when they choose to drive, and although everyone has a different threshold for the risk they are willing to tolerate, there is a gap between that threshold and the risk they perceive.
If the risk they perceive is below their threshold, they will be comfortable engaging in more risky behavior, like driving even faster or playing on their phone.
It is neither random nor reckless that people sense this forgiving road design and engage in more risky behavior. This is the human psychological assessment of risk.
Recall from the previous section, if 85% of people are speeding, transportation engineers don’t consider it reckless. Rather, they reward the risky behavior of speeding by increasing the posted speed.
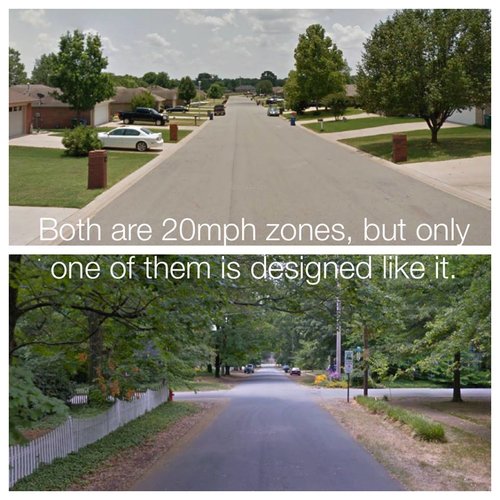
Contrast forgiving road design with a road with narrow lanes, no shoulders, steep slopes, tight curves, and lined with trees, bike lanes, or parked cars.
If you picture this road now, you will not feel safe driving fast because you sense a lack of forgiveness and perceive the risk of driving fast to be high.
This lack of forgiveness makes sense in cities where drivers should be driving slower anyway.
The problem is transportation engineers have applied forgiving highway design standards to city streets, and they continue to do so without regard for how drivers assess risk.
Even though they intend to post a 35 or 40 mph speed limit, they design city streets with wide lanes, wide shoulders, gentle slopes, sweeping curves, and free of surrounding fixed objects, such as trees and parked cars.
The result is people speeding.
The application of forgiving design standards to city streets is a risk factor for traffic deaths and injuries because it results in increased speeds.
Relying on methods to establish posted speeds and design standards for urban areas that are based on highways in rural areas has proven unsafe because the streets in urban areas are increasingly more dangerous than rural areas for people driving, walking, and biking.
For example, the share of traffic deaths in urban areas rose from 39% in 2000 to 57% in 2017, according to the Insurance Institute for Highway Safety (IIHS).
“90 percent of the top pedestrian fatality hotspots are on roadways with three or more lanes,” according to the National Roadway Safety Strategy.
Urban arterials—roads that link highways to major activity centers in urban areas—accounted for 29% of all U.S. fatal crashes between 2014 and 2018, despite making up only 6% of roadways.
In Cleveland, 35% of traffic fatalities and serious injuries occur on 7% of city streets.
In Minneapolis, 70% of the worst traffic crashes occur on 9% of city streets.
In San Francisco, 75% of severe traffic injuries and fatalities occurred on 13% of city streets.
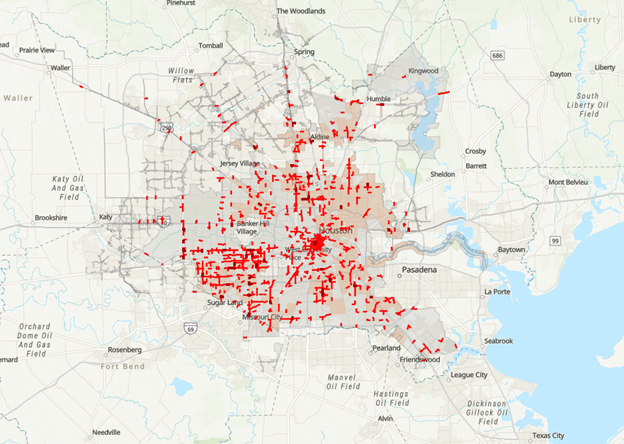
In Texas, a state that has not gone a single day without a traffic fatality since November 2000, 60% of traffic deaths in Houston occurred on 6% of Houston roadways; 70% of traffic deaths in Austin occur on 7% of streets; and 33% of severe pedestrian injury crashes in San Antonio occurred on 1% of San Antonio roadways.
Thanks to cities who have mapped traffic injuries and deaths, known as a High Injury Network (HIN), we know that traffic crashes and fatalities, particularly those in cities, are not random. Street design is a risk factor.
Risk Factors for Fatal Motor Vehicle Crashes: Vehicle Design
Vehicle design is perhaps the most critical contributor to the recent spike in traffic deaths on American roads. Many blame the growing size and weight of SUVs and passenger trucks and the continued investment in auto-centric development.
From 2009 to 2016, pedestrian fatalities from SUVs increased 81%, which is more than other type of vehicle according to IIHS.
SUVs and passenger trucks are 2 to 3 times more likely to kill a pedestrian than smaller vehicles.
“Large vehicles are 2 to 3 times more likely to kill a pedestrian than smaller models due to their weight, height, and aggressive front-end vehicle design – all of these factors inflict more damage on the internal organs, heads, and necks of walkers than lighter lower-profiles cars which are more likely to strike a pedestrian’s lower extremities,” according to Families for Safe Streets based on a 2015 request for public comments on the New Car Assessment Program (NCAP) from the National Highway Traffic Safety Administration.

Additionally, many design features of megacars have created more/worse blind spots.
Blind spots increase the likelihood of striking a person or another vehicle.
“For instance, the massive blind zones of the 2021 Ford F-150, one of the most popular new cars sold in the U.S today, can fit a staggering 578 preschoolers if they crowd close together, according to a calculator sponsored by USDOT,” according to Kea Wilson with Streetsblog USA.
“That means that the physical design of megacars themselves may be increasing the likelihood of their drivers’ hitting walkers — and when that happens, those cars are generally about two to three times more likely to kill.”
However, government officials are failing to recognize the problem of the growing size, weight, and power of vehicles.
For example, the Governor’s Highway Safety Association failed to mention the size of vehicles in their 2017 report on pedestrian traffic fatalities. The 2022 National Roadway Safety Strategy only mentioned vehicle size in reference to commercial vehicles.
“Federal safety regulators have known for years that SUVs, with their higher front-end profile, are at least twice as likely as cars to kill the walkers, joggers and children they hit, yet have done little to reduce deaths or publicize the danger,” according to an investigative report by the Detroit Free Press and USA Today Network.
Protective Factors for Fatal Motor Vehicle Crashes
Protective factors for traffic violence include low posted speed limits, low design speeds, urban design standards, pedestrian/bicycle infrastructure, limitations on vehicle size and weight, advanced vehicle safety tests, and updated theories of traffic safety.
Designing urban roads with narrow lanes, tight curves, and lined with trees, bike lanes, and/or parked cars discourages people from driving fast on city streets.
Congestion is also thought to be a protective factor against traffic deaths because people can’t drive as fast if there is congestion.
Many think the delay in implementing protective factors is not a lack of data, but a clash of values.
Both empirical research and natural experiments have demonstrated that systemic efforts to reform streets from forgiving design to the forgiveness of slow speeds will improve safety.
However, reforming streets often requires stakeholders to revise transportation guidance, standards, manuals, policies, and other documents to prioritize accessibility over mobility, and this requires a shift in values from speed to safety—because you can’t prioritize both.
This also requires updating theories of traffic safety to consider the psychological aspect of risk assessment.
To this end, victim-blaming, system justification, and mobility-thinking, which are often rooted in assumptions of and/or beliefs in utility, meritocracy, and value-free rationality, also contribute to risk factors for traffic deaths,.
It is important to note for the sake of this series that reforming streets is an upstream approach to primary prevention, which will be explained in the third post in this four-part series.
Regarding vehicle design, protective factors include laws and/or regulations that limit vehicle size, vehicle weight, and the height of hoods and bumpers, as well as laws and/or regulations that require vehicle safety tests for pedestrian impact protection, advanced driver assistance systems to improve detection systems for vulnerable road users, and ignition interlock systems for drunk driving offenders, among others.
Ignition interlock systems target individuals that were charged with drunk driving and temporarily restricts their ability to drive their vehicle unless able to prove through the device that their blood alcohol concentration is below that allowed by the monitoring authority.
However, the U.S. is failing on many of these regulations.
Regarding advanced driver assistance systems, there is concern that these new safety technologies will not be able to deliver on many safety promises due to lack of regulation, such as lack of regulation on detection systems for vulnerable road users.
For example, although driver error is thought to be responsible for nine in 10 crashes, analysis from the Insurance Institute for Highway Safety “suggests that only about a third of those crashes were the result of mistakes that automated vehicles would be expected to avoid.”
Moreover, there is concern that there will be too much reliance placed on advanced driver assistance systems to the detriment of other effective strategies.
Advanced driver assistance systems could be a protective factor against traffic fatalities if two conditions are met.
First, advanced driver assistance systems must be adequately regulated to detect and protect vulnerable road users.
Second, strategies to regulate and improve advanced driver assistance systems must be layered with other strategies to reduce vehicle speed, size, and weight, and to improve walking/biking infrastructure.
Layering multiple strategies is known as the Swiss Cheese model of risk reduction, which will be explained in the third post in this four-part series.
Why Gun Violence Is Not Random
Gun violence deaths, like traffic crash deaths, are not random.
Data show that homicide is three times more likely if there is a gun in the home, according to The State of America’s Children 2021: Gun Violence released by the Children’s Defense Fund.
Accidental death is four times more likely if there is a gun in the home.
Yet these facts are often discounted amid gun regulation controversies.
Worse, these facts are often used to racialize and stigmatize the narrative of individual responsibility, and don’t take into account the enduring impact of structural racism.
Indeed, the ongoing lack of research and reporting on the growing size of vehicles, rising speeds, and lack of vehicle regulation as contributors to traffic deaths seems similar to the lack of research and reporting on the increasing guns per capita and lack of gun regulation as a risk factor for gun deaths.
What risk factors are behind gun violence? What protective factors might be used to help?
Risk Factors for Gun Violence
Risk factors for firearm violence include access to/presence of guns in the home, individual history of violence, community history of violence, community history of segregation and disinvestment, and strictness of state gun laws.
CDC identified four risk factors for youth violence:
- Individual Risk Factors
- Family Risk Factors
- Peer and Social Risk Factors
- Community Risk Factors
“The [American Academy of Family Physicians (AAFP)] acknowledges that violence occurs in the context of a broad range of human relationships and complex interactions,” according to an AAFP policy position paper on gun violence. “These encompass social, cultural, and economic risk factors, including but not limited to, the influence of the media, substance abuse, interpersonal violence, fragmentation of family life, and the increased availability of weapons.”
“Gun violence is associated with a confluence of individual, family, school, peer, community, and sociocultural risk factors that interact over time during childhood and adolescence,” according to a report from the American Psychological Association.
Risk Factors for Gun Violence: Individual Level
Individual risk factors include history of violent victimization, history of early aggressive behavior, exposure to violence and conflict in the family, and toxic stress.
Toxic stress is brought about by repeated stressful and traumatic experiences with no supportive relationships resulting in a dysregulation biological stress response system and subsequent changes in other biological and physiological functions.
These changes disrupt development of the brain architecture and other organ systems and increase risk for cognitive impairment and behavioral problems.
Risk factors for toxic stress include physical/emotional/sexual child abuse, parental substance abuse, poverty, racism, and historical trauma.
Risk Factors for Gun Violence: Family Level
Family risk factors include low parental involvement, authoritarian childrearing attitudes, parental substance abuse or criminality, and low emotional attachment to parents/caregivers.
Many of these risk factors are also risk factors for toxic stress.
When considering gun violence specifically, family risk factors include access to/presence of guns in the home.
Despite that many claim they keep guns in the home for protection, guns in the home are more likely to endanger than to protect loved ones.
“The presence of a gun in the home makes the likelihood of homicide three times higher, suicide three to five times higher, and accidental death four times higher,” according to The State of America’s Children 2021: Gun Violence released by the Children’s Defense Fund.
Risk Factors for Gun Violence: Peer and Social Level
Peer and social risk factors include association with delinquent peers, social rejection by peers, low commitment to school, school failure, and lack of involvement in conventional activities.
Many of these risk factors for violence are also signs and symptoms of toxic stress.
Thus, efforts to reduce gun violence must consider how to mitigate toxic stress, particularly among children and youth.
Risk Factors for Gun Violence: Community Level
Community risk factors may prove the most fruitful target of public health approaches to gun violence.
These risk factors include diminished economic opportunities, high concentration of poverty, high level of transiency, community trauma, and low levels of community participation.
Community risk factors exacerbate individual, family, and peer/social risk factors.
They also are similar to and exacerbate risk factors for toxic stress, such as living impoverished neighborhoods and experiencing racism.
“There’s a reason certain neighborhoods have much higher rates of gun violence,” said Daniel Webster at the Johns Hopkins Center for Gun Violence Solutions, part of the university’s Bloomberg School of Public Health, according to USA Today. “It has to do with disinvestment, the conditions within those neighborhoods, the lack of opportunities in those neighborhoods.”
Community Risk Factors for Gun Violence: Redlining
Many claim that disinvestment in neighborhoods started with redlining.
Redlining is a legacy of the Home Owners Loan Corporation (HOLC), which was commissioned by the Franklin Roosevelt Administration as part of New Deal, that used the racial and ethnic composition of neighborhoods to determine the worthiness for government-backed investment and economic development.
They created maps in 239 US cities in the 1930s, in which areas with large minority populations were designated harmful and lined in red, thus deprived of federally-insured home loans and public investment. In turn, areas with white populations were designated desirable and lined in green, thus supplied with federally-insured home loans and public investment.
This “set the stage for devaluation of Black communities through geographic concentration of intergenerational poverty, poor education, and dismal social mobility within these intentionally blighted communities,” according to researchers with the Boston University School of Medicine.
Depriving people of color federally-backed loans and disinvesting in their schools and communities led to the “good” and “bad” neighborhoods we see today as well as to the academic and wealth gaps between minority and white populations that persist today.
Researchers with the Boston University School of Medicine found that shooting rates in Boston are significantly higher in the areas designated as harmful (red) compared to areas designated as desirable (green).
These differences were mediated by the socioeconomic and demographic makeup of urban neighborhoods which, again, are the direct consequences of racist housing policies.
“The current study helps refute the idea of individual responsibility alone by highlighting the enduring impact of structural racism in the form of redlining and the downstream socioeconomic and built environment factors that contribute to the incidence of firearm violence to this day,” according to the researchers.
Researchers in Pennsylvania found that firearm violence in Philadelphia is eight times higher in areas designated as harmful (red) compared to areas designated as desirable (green).
“When we look at the 1937 HOLC Map in relationship to contemporary violence and firearm assaults [in Philadelphia], we find that the same places that were imagined to be areas unworthy of economic investment by virtue of the races, ethnicities, and religions of their residents are more likely to be the places where violence and violent injury are most common almost a century later,” according to the researchers.
These studies are a great reminder that race is a social construct and is an inadequate a proxy for understanding socioeconomic, community, and policy risk factors, as well as a reminder to consider the historical/temporal frame to understand the associations between exposures and outcomes across generations and historical forms of structural racism.
Researchers need to consider how structural racism and its perpetuation through various policies and practices, such as single-family zoning, contribute to inequities in violent child deaths from firearms.
Single-family zoning perpetuates the discriminatory legacy of redlining by excluding people with low-incomes from neighborhoods with high opportunity and concentrating them in neighborhoods with low-opportunity.
Again, efforts to reduce violence must focus on mitigating toxic stress, particularly in schools.
When considering gun violence specifically, additional community risk factors include strictness of state gun laws, to include private gun sale laws, safe storage laws, and “stand your ground” laws.
Community Risk Factors for Gun Violence: Lack of Gun Regulation
Weak state gun laws put their residents at risk due to increased availability of weapons.
“An estimated 4.6 million children live in homes with at least one unlocked and loaded gun,” according to The State of America’s Children 2021: Gun Violence released by the Children’s Defense Fund.
 Only slightly more than half of gun owners with children in the home safely store their guns, according to researchers at the Johns Hopkins Bloomberg School of Public Health.
There is no federal law requiring gun owners to safely store their guns, even if children are present.
Few states have safe storage or gun locks, and few impose civil or criminal liability on persons who negligently store firearms, where children could or do gain access. Learn more about which states have child access preventions laws.
Many think the U.S. is an outlier among other high-income nations with respect to firearm violence because the U.S. has many more guns per capita and the most relaxed gun laws.
“Americans accounted for less than five percent of the global population, but owned nearly half (46 percent) of all civilian guns in the world,” according to The State of America’s Children 2021: Gun Violence released by the Children’s Defense Fund.
When compared to other high-income countries, firearm homicide rates were 13.5 times higher in low-gun U.S. states but 36 times higher in high-gun U.S. states, according to a 2019 article in Preventive Medicine.
Community Risk Factors for Gun Violence: Gun Access
Although the Brady Handgun Violence Prevention Act, which requires federally licensed gun dealers to conduct background checks on purchasers, went into effect in 1998, loopholes exist for “private” sales that occur at gun shows, online, and in the streets.
It is through these private sales that many ineligible people obtain access to guns.
“One in three mass shooters are legally prohibited from possessing firearms at the time of the shooting,” according to a 2020 report from Everytown for Gun Safety on mass shootings in the U.S.
Although gun manufacturers, importers, and dealers must maintain records of sales and report if guns were lost or stolen, private gun owners are not required to maintain records.
Compare this to regulations on the private sale of a vehicle which requires the seller to have the vehicle be both titled and registered.
Additionally, “ghost guns”
 Overall, there is no federal gun trafficking statute.
This is a problem because guns purchased in states with weak gun laws are sometimes trafficked to states with stronger gun laws.
For example, according Giffords 50 State Factsheets, from 2013 to 2017:
- More than 57% of guns recovered at Hawaii crime scenes originated from out of state.
- 3,614 guns originally purchased in other states were recovered after being used in crime in Oregon.
- 9,614 guns originally purchased in Alabama were recovered after being used in crime in other states.
- 16,630 guns originally purchased in Florida were recovered after being used in crimes in other states.
- 21,024 guns originally purchased in other states were recovered after being used in crime in Illinois.
In fact, roughly 90% of crime guns used annually come from just 5% of licensed gun dealers, according to the gun violence prevention group, Brady.
Although the Gun Control Act of 1968 was updated in the 1990s to prohibit the possession of firearms by people convicted of domestic violence misdemeanors, domestic violence conviction is incredibly rare compared to the prevalence.
Many also blame “bad apple” federally licensed gun dealers for supplying the criminal gun market, according to the gun violence prevention group, Brady.
While licensed gun dealers are required to conduct a background check prior to every gun sale, gun shows and individual sellers are not.
“[Legal] guns are diverted into illegal gun markets in three common ways: straw purchases; secondary sales through private sellers; and theft from individual gun owners or firearm dealers, according to a fact sheet from the Center for American Progress.
Additionally, anyone can purchase a “ghost gun kit” and assemble an unserialized and untraceable firearm known as “ghost gun.”
In 2021, law enforcement recovered approximately 20,000 suspected ghost guns in criminal investigations which were reported to the Bureau of Alcohol, Tobacco, Firearms and Explosives (ATF), according to a White House fact sheet. This was 10 times more ghost guns recovered than 2016.
These gun kits are available to be purchased by anyone, including prohibited purchasers, domestic abusers, and gun traffickers to purchase a firearm without a background check.
“The availability of ghost gun parts and kits is creating a gaping, and dangerous, loophole that undermines currently enacted gun-related regulations,” according to Brady’s website.
Community Risk Factors for Gun Violence: ‘Shoot First’ Laws
Shoot First laws, also known as Stand Your Ground laws, allow a person to kill another person even when they could have clearly and safely de-escalated the confrontation by retreating.
These laws incite fear, encourage the use of deadly violence, and strip alleged criminals of their humanity by suggesting they are not worthy of due process and that their lives are worth less than someone else’s comfort or property.
“[These laws] distort the public perception of lawful self-defense and encourage people to shoot first and ask questions later,” according to a fact sheet from Everytown Research and Policy.
Numerous studies have found that these laws are associated with increases in firearm homicides.
A 2021 study published in the American Journal of Public Health examined 25 studies that estimated population-level impacts of Shoot First/Stand Your Ground laws and found zero evidence that these laws deter violent crime.
Rather, they found that in some contexts, Shoot First/Stand Your Ground laws are associated with increases in violence. They also found there are racial inequities in the application of these laws.
A 2022 study in the Journal of the American Medical Association found that Shoot First/Stand Your Ground laws were associated with an 8% to 11% national increase in monthly rates of homicide and firearm homicide.
The study found that Shoot First/Stand Your Ground laws in Alabama, Florida, Georgia, Louisiana, and Missouri were associated with increases in firearm homicide ranging from 16.2% to 33.5%.
The RAND Corporation also conducted a systematic review of the effects of Shoot First/Stand Your Ground laws and found zero evidence that these laws deter crime.
Twenty-one states have rejected Shoot First/Stand Your Ground legislation.
Learn more from the RAND Corporation’s systematic review of the effects of 18 broad classes of gun policies (e.g., extreme risk protection orders, child-access prevention laws, and Shoot First/Stand Your Ground laws) on eight outcomes (e.g., mass shootings and violent crime).
Community Risk Factors for Gun Violence: High-Capacity Magazines
Access to high-capacity magazines is also a risk factor.
Although Congress enacted a federal ban on assault weapons and large capacity magazines in 1994, the law expired in 2004.
High-capacity magazines account for an estimated 22%-36% of crime guns, according to Every Town.
Additionally, although 17% of mass shootings involved guns with high capacity magazines between 2009 and 2018, mass shootings that involved these guns accounted for 32% of deaths and 82% of injuries, according to Every Town.
Guns with high-capacity magazines led to six times as many people shot per mass shooting.
Protective Factors for Gun Violence
The CDC also has three categories of protective factors for youth violence:
- Individual Protective Factors
- Family Protective Factors
- Peer and Social Protective Factors
Not included are community protective factors, which we will focus on below.
Individual protective factors include high grade point average, positive social orientation, and highly developed social skills/competencies.
Family protective factors include ability to discuss problems with parents, frequent shared activities with parents, involvement in social activities, and parental/family use of constructive strategies for coping with problems.
Peer and social protective factors include commitment to school, close relationships with non-deviant peers, membership in peer groups that do no condone antisocial behavior, and involvement in prosocial activities.
Though not included by the CDC, researchers across the country have found that addressing adverse childhood experiences and toxic stress can also be viewed as a protective factor at the individual, family, peer/social, and community level.
Community Protective Factors for Gun Violence
Community protective factors for gun violence include a trauma-informed workforce, child access prevention laws, absence of Shoot First/Stand Your Ground laws, extreme risk protection orders, and other gun regulations.
“States with child access prevention laws that require gun owners to ensure children do not gain unauthorized access to their firearms report fewer firearm suicides among adolescents,” according to the Johns Hopkins Bloomberg School of Public Health.
States with restrictions on magazine size experience mass shootings at less than half the rate of states without restrictions, according to Every Town.
“You can reduce injury rates without banning guns, just like everyone reduced motor vehicle crash rates without banning cars,” said Jason Goldstick, research associate professor at the University of Michigan, according to Aria Bendix with NBC News.
Because a public health approach should focus on supporting/enhancing protective factors that have the potential to impact entire populations, a public health approach should focus on community protective factors.
“Reducing access to guns will not take away the violence, but it will dramatically reduce the killings, the critical injuries,” said Dr. Michael Rodriquez, physician and professor at University of California, Los Angeles, and co-director of the university’s Firearm Violence Prevention Center, according to USA Today.
Community Protective Factors for Gun Violence: Extreme Risk Protection Laws
Domestic violence protection orders are a preventive tool for judges to temporarily restrict access to firearms in cases of domestic violence and are legal in all 50 states.
These orders are associated with a 12% reduction in intimate partner homicide, according the Johns Hopkins University HUB.
After all, 54% of mass shootings are domestic-violence related, according to a 2020 report from Everytown for Gun Safety on mass shootings in the U.S.
“We do have good evidence showing that for the most severe forms of intimate partner violence, one of the best things that you can do is intervene with a domestic violence protection order that includes prohibitions on gun purchase and possession,” said Shannon Frattaroli, a professor of health policy with the Johns Hopkins Center for Gun Violence Solutions, according to the Johns Hopkins University HUB. “Therefore, if we expand those protections to include other types of violent threats, it stands to reason that we should expect to see reductions as well.”
Nineteen states and Washington D.C., as of August 2022, have expanded those protections to include other types of violent threats through extreme risk protection orders.
Modeled after domestic violence protection orders, extreme risk protection orders are another preventive tool to get guns out of the hands of people who are thought to be in imminent danger of self-harm or harming others, beyond their intimate partners.
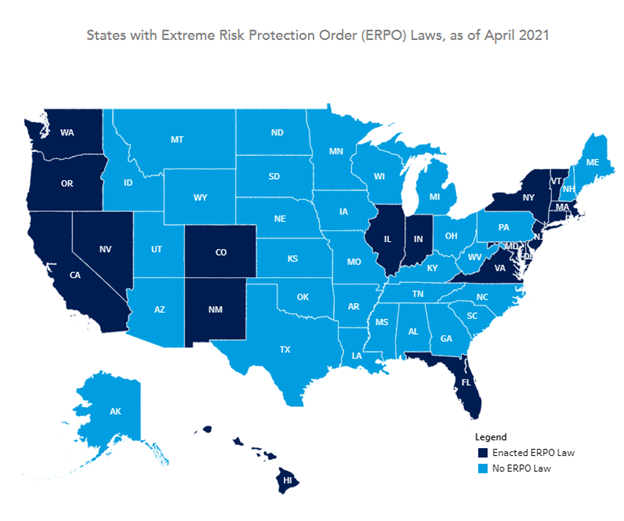
In states with extreme risk protection orders, also known as red flag laws, law enforcement, family members, or medical professionals can petition a civil court to temporarily restrict access to firearms arms if a person is at high risk for committing violence, whether to themselves or others.
These preemptive protective orders provide a legal framework to remove firearms and reduce access to new firearms among high-risk individuals for one to three weeks. After a hearing, the judge may grant a petition or extend the order for a year.
As civil orders, extreme risk protection orders do involve the person at-risk in the criminal justice system. Rather, they aim to prevent crime and subsequent involvement in the criminal justice system.
“Extreme risk protection orders are a civil option for when someone is behaving dangerously and at risk of committing violence,” Frattaroli said. “This is an opportunity to intervene before a crime happens.”
Because extreme risk protection orders are relatively new, there is little evidence regarding their impact on homicides and mass shootings.
A new study from the Violence Prevention Research Program at UC Davis examined the impact of the first three years (2016-2018) of California’s extreme risk protection law, known as gun violence restraining order (GVRO).
They found 80% of the 202 cases where a judge deemed the need to temporarily restrict an individual’s access to firearms involved people that were a risk of harm to others as opposed to only a risk of harm to themselves.
28.7% of the inciting events that led to an extreme risk protection order involved threatened mass shootings, 24.3% took place at a public venue, including schools and workplaces, and 16.8% had a child present.
All six cases involving minors involved threatened mass shootings that targeted schools.
“The findings suggest GVROs are being used as intended—to remove firearms from individuals threatening to harm themselves, their intimate partners, co-workers, classmates or the general public,” said Veronica Pear, lead author of the study and an assistant professor in the Department of Emergency Medicine at UC Davis Health, according to a UC Davis press release.
The study also found that 96.5% of the extreme risk protection orders were filed by law enforcement, compared to 3.5% filed by family or household members.
While some think the Robb Elementary School shooting in Uvalde, Texas, on May 24, 2022, could have been prevented through improved school hardening of the roughly 80,000 school buildings in the state of Texas, some think that has already happened and tougher security can come with real downsides.
Meanwhile, others think it could have been prevented if Texas had an extreme risk protection law.
After all, the 18-year-old Robb Elementary School shooter made explicit threats of violence beforehand, which were reported to police. However, without an extreme risk protection law, police in Uvalde, Texas had no legal options to temporarily restrict the shooter’s access to firearms.
“Many acts of firearm violence are preceded by implicit or explicit threats, including two- thirds of public mass violence.” https://www.secretservice.gov/sites/default/files/reports/2020-09/MAPS2019.pdf
Threat of mass violence is often defined as a threat to shoot an unspecified number of people or at least three people other than oneself.
“In 56% of mass shootings, the shooter exhibited dangerous warning signs before the shooting,” according to a 2020 report from Everytown for Gun Safety on mass shootings in the U.S.
However, existence of an extreme risk protection law doesn’t guarantee it is practiced.
For example, Illinois has an extreme risk protection law but the Highland Park suspect from the July 4, 2022, Highland Park shooting was still able to obtain firearms and kill despite an alleged previous suicide attempt and threats of violence against his family, according to the Johns Hopkins University HUB.
Similarly, New York has an extreme risk protection law, but an 18-year-old shooter was able to access a gun and killed 10 people at a supermarket in Buffalo, New York on May 27, 2022, despite months of threats and concerning behavior.
Some blame lack of statewide training.
That’s why, in June 2022, Congress passed bipartisan legislation that included $750 million to help states create or expand extreme risk protection orders, to included funding for training.
To raise awareness about extreme risk protection orders, the Johns Hopkins Center for Gun Violence Prevention and Policy, in partnership with the Bloomberg American Health Initiative at the Bloomberg School of Public Health and the Educational Fund to Stop Gun Violence, developed free online education materials with scientific data and first-person accounts of those who are on the front lines using extreme risk protection orders as a tool to save lives.
We Need Strategies to Reduce Risk Factors and Increase Protective Factors
Traffic crash deaths and gun violence deaths are not random.
Nor can they be pinned only on individual behavior.
Date show that these are systemic issues on the rise amid many risk factors and protective factors, which warrant a public health approach to reduce risk factors and increase protective factors to prevent violent child deaths and injuries.
A comprehensive, multi-layered public health approach will:
- Define and monitor the problem
- Identify risk and protective factors
- Develop prevention strategies
- Ensure adoption of strategies
What does that look like in reality?
Read the next post in the series about developing prevention strategies, which will be released Dec. 1.
By The Numbers
27
percent
of Latinos rely on public transit (compared to 14% of whites).