Share On Social!
The CDC recently revised Body Mass Index (BMI) charts for children to help healthcare providers better track growth in children and identify “severe obesity.”
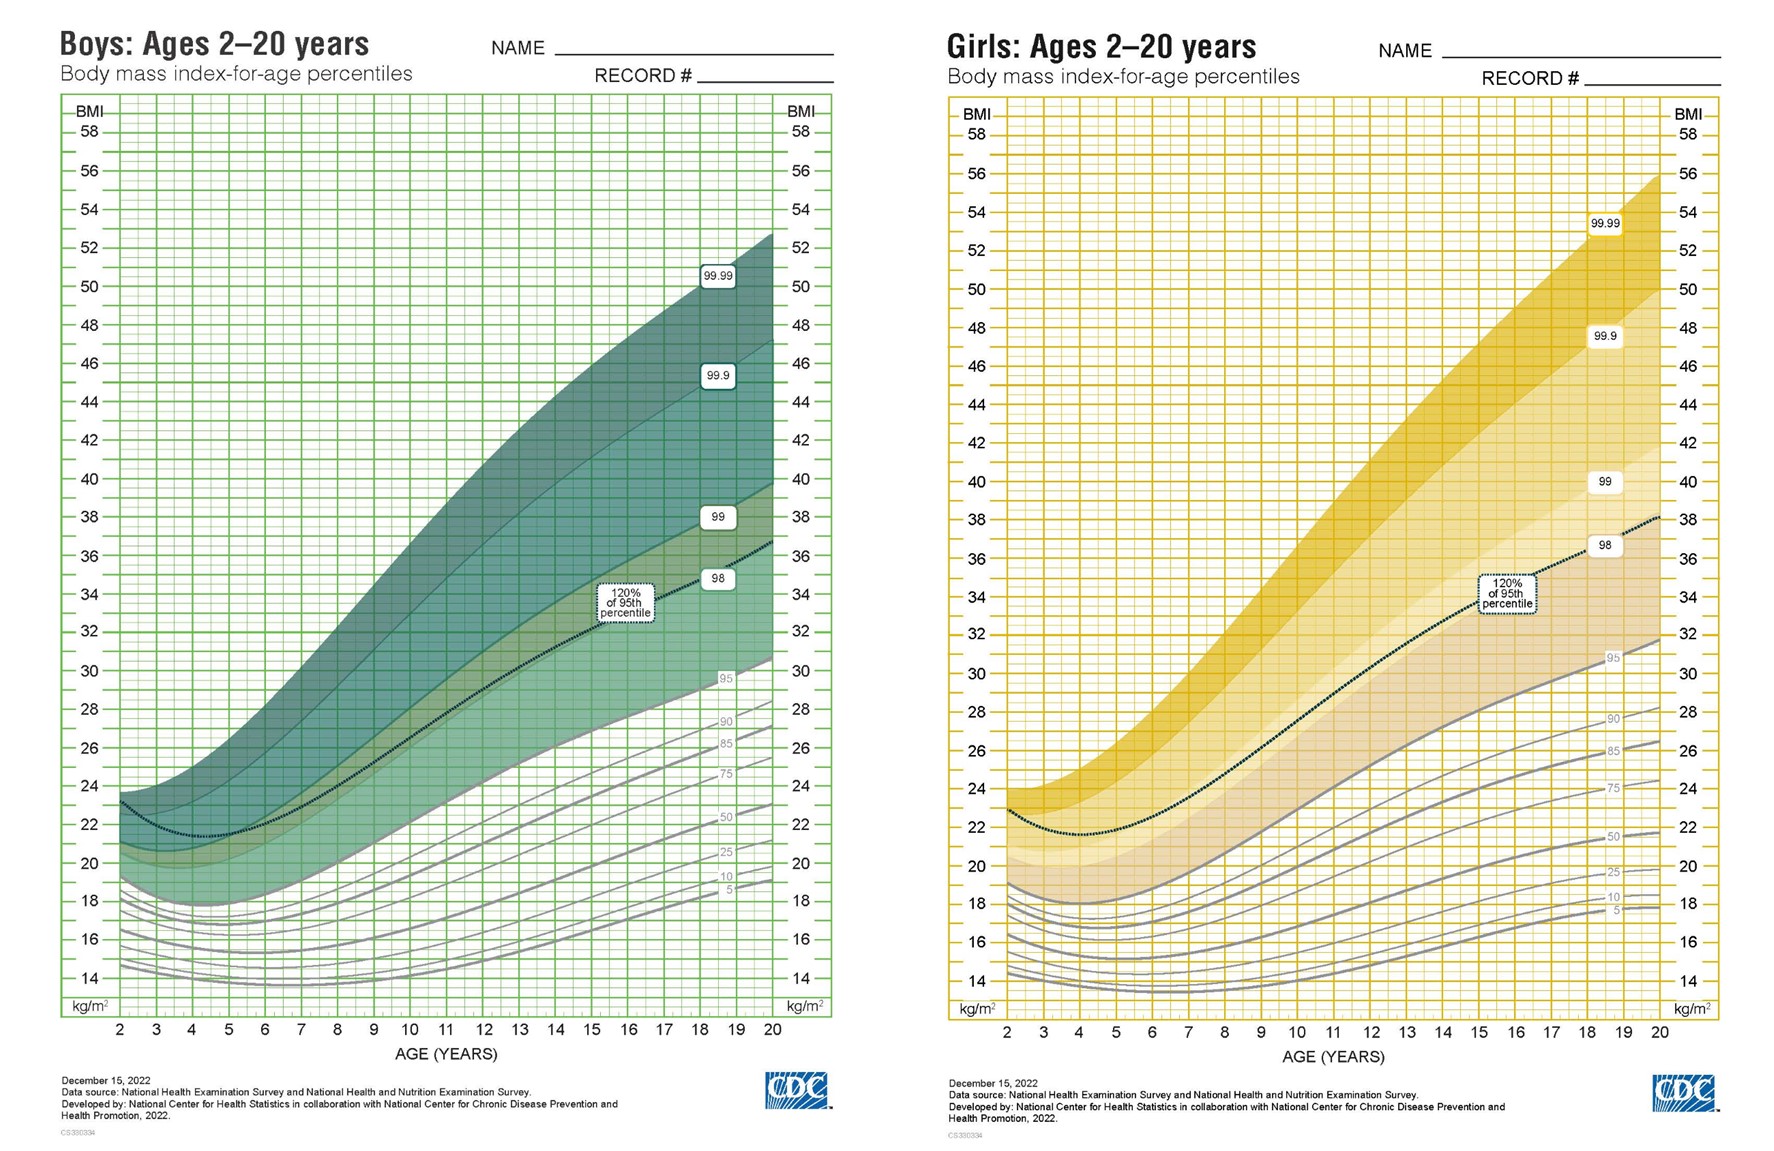
Before the update, BMI charts for children did not go above 37. The revised charts extend to a BMI of 60 to account for the rise of severe obesity in children ages 2-20, according to the CDC.
Now clinicians can more easily see whether a child’s BMI falls within the range of underweight, ideal weight, overweight, obese, or severely obese, based on a percentile measured against other children of the same age and gender, according to CNBC and healthline.com.
A BMI higher than 95% of kids of the same age and other factors is defined as obese. Severe obesity is a BMI 120% higher than the 95th percentile, according to the CDC.
“Intervening early is critical to improving the health of our children as they grow into adults. Prior to today’s release, the growth charts did not extend high enough to plot BMI for the increasing number of children with severe obesity,” said Dr. Karen Hacker of the CDC in a statement. “The new growth charts coupled with high-quality treatment can help optimize care for children with severe obesity.”
Let’s dig deeper into these changes and what they mean for Latinos and all people!
1. What Is BMI?
BMI is a measurement that helps clinicians and researchers screen people for weight categories that may lead to health problems. It does not diagnose the body fatness or health of an individual, according to the CDC.
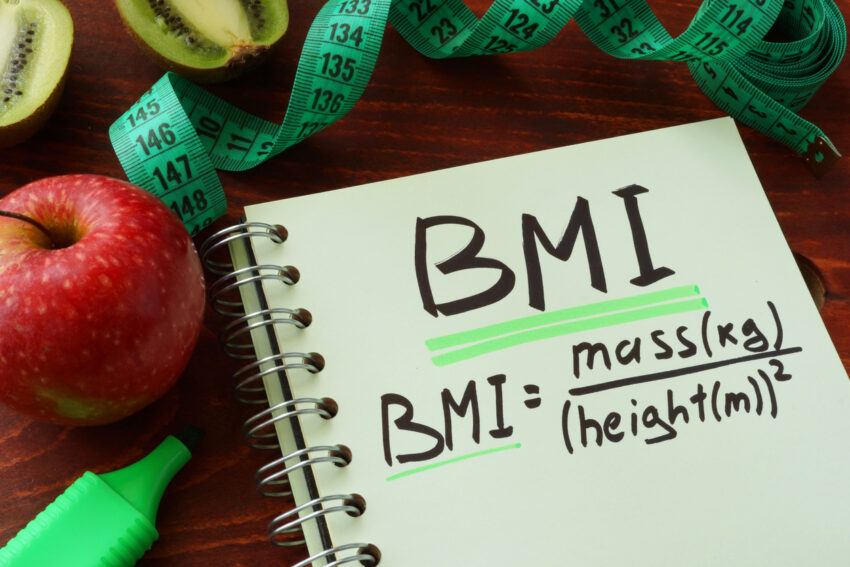
BMI is defined as “a measure of body fat based on height and weight that applies to adult men and women.”
The BMI of an individual is calculated by dividing an individual’s height by their weight.
For adults, a normal BMI falls between 18.5 and 24.9.
The BMI chart for children is plotted based on percentiles. The normal-weight BMI range varies over time as the child grows.
“Percentiles are a method of grouping and ‘ranking’ for easier comparison. For instance, if a child’s BMI falls within the 60th percentile, it means that 60% of kids the same age had the same or lower BMI score,” according to healthline.com.
2. Why Did the CDC Update the BMI Chart?
The BMI chart hasn’t been updated since 2000, when it was based on population data from 1963 to 1980.
“Under the previous charts, it was difficult to categorize the severity of obesity,” Dr. Paula Newton, a pediatrician at the University of Maryland School of Medicine, told healthline.com. “Everyone with a BMI over the 95th percentile was lumped together in the same category of ‘obese’ [despite levels of severity].”
 The revised BMI chart for children is based on newer child population data from 1988-2016.
Along with the extended percentiles, the new BMI charts will also allow pediatric healthcare providers and researchers to track a child’s trajectory against these new curves that reflect measurements of real children with obesity.
“Under the new guidelines, healthy BMI for kids can range from as low as around 13 to about 17 for a 6-year-old girl or boy to a range of as much as roughly 18 to around 26 for a 20-year-old young woman,” according to CNBC.
To view the BMI-for-age growth charts, visit the CDC’s website.
3. What Happens to the Old BMI Charts for Children?
The 2000-era BMI charts are still appropriate to use for most children and adolescents.
“[The revised charts] do not replace the 2000 CDC BMI-for-age growth charts. Instead, they are an extension of the existing curves to be used by those needing to track very high BMIs,” according to the CDC.
The CDC’s Dr. Karen Hacker encouraged healthcare providers to use the new BMI growth charts as a tool when working with children and adolescents with severe obesity.
“Childhood obesity is a serious and increasing problem in the United States. The Extended BMI-for-Age Growth Charts allow clinicians to track growth and visualize high BMI percentiles with families,” said Dr. Karen Hacker of the CDC in a statement. “This can help optimize care for children and adolescents aged 2 – 19 with severe obesity. Severe obesity is defined as a BMI greater than or equal to 120% of the 95th percentile on BMI-for-Age growth charts.”
4. Is BMI the Best Measure?
Health experts have often criticized the use of BMI as a not consistently useful or accurate measure of health.
BMI has several limitations, according to a Salud America! resource:
- BMI is a measure of body size; it is not a measure of health.
- BMI measures weight; it doesn’t measure body fat.
- Standards for BMI are based on Western ideals and European body types.
- BMI can contribute to anti-fat stigma.
“This recognition has led many to begin to consider what other measures might be used or even whether tracking obesity rates in this way is useful at all,” according to a report from the Robert Wood Johnson Foundation.
BMI also doesn’t account for social, economic, and environmental influences – which are important considerations for Latino children and families.
5. How Does the Change in BMI Affect Latinos?
Latino families often face health differences that create social need and negatively impact health.
Differences include low wages and limited employee benefits, underperforming schools, lack of medical providers, unstable and unaffordable housing, unreliable transportation options, and unsafe streets and parks, and limited availability of nutritious food.
“Fast food places and corner stores outnumber supermarkets and farmers’ markets in many Latino neighborhoods,” according to a Salud America! resource.

That creates an environment for the rise of obesity.
Latino adults have higher obesity rates than their white peers (47% and 37.9%), as do Latino children (20.7% and 11.7%).
At a doctor’s office, a BMI screening should be more than a number – it should be a signal to investigate a child’s access to healthy food, physical activity habits, mental health, and more.
“We need to ask questions about what is happening at school, who the primary caregiver is, [if there] is food scarcity, and consider [background] beliefs connected to food consumption,” Dr. Ilan Shapiro of AltaMed Health Services, told healthline.com.
6. How Can You Create Healthy Environments for Children in Your Community?
Download the Salud America! Health Report Card.
The Health Report Card will help you explore local data visualizations on access to food, grocery stores, and other health improvement issues.
See how your community compares to other counties and states across the nation!
Email your Health Report Card to community leaders, share it on social media, and use it to make the case to address childhood obesity and improve nutrition!
By The Numbers
1
Supermarket
for every Latino neighborhood, compared to 3 for every non-Latino neighborhood