
Share On Social!
The coronavirus, COVID-19, can affect anyone.
But reports show Latinos and other overlooked populations are more affected, amid worsening health differences.
What are the data really showing?
UPDATE 3/5/24: CDC releases new COVID-19 death rates by background.
COVID-19 Case Rates for Latinos
The U.S. population recently rose to 19.1% Latino.
 At the outset of the pandemic, COVID-19 sickened many Latinos. Variants like Delta and Omicron sparked case surges, too.
Latinos comprised 24.3% of COVID-19 cases in the United States, second only to Whites (53.8%), according to CDC data on health improvement and cases on April 19, 2023. As of March 5, 2024, CDC is no longer maintaining incidence rates by background on this web page.
Several states experienced Latino coronavirus case differences, too.
California is 39.3% Latino. But they made up 44.3% of COVID-19 cases as of May 9, 2023 (when the data stopped being maintained).
COVID-19 Death Rates for Latinos
14.8% of deaths from COVID-19 in the United States are among Latinos, as of Feb. 15, 2024, according to a CDC Data Tracker. That is a higher percentage than Blacks (13.6%) and lower than Whites (67.2%).
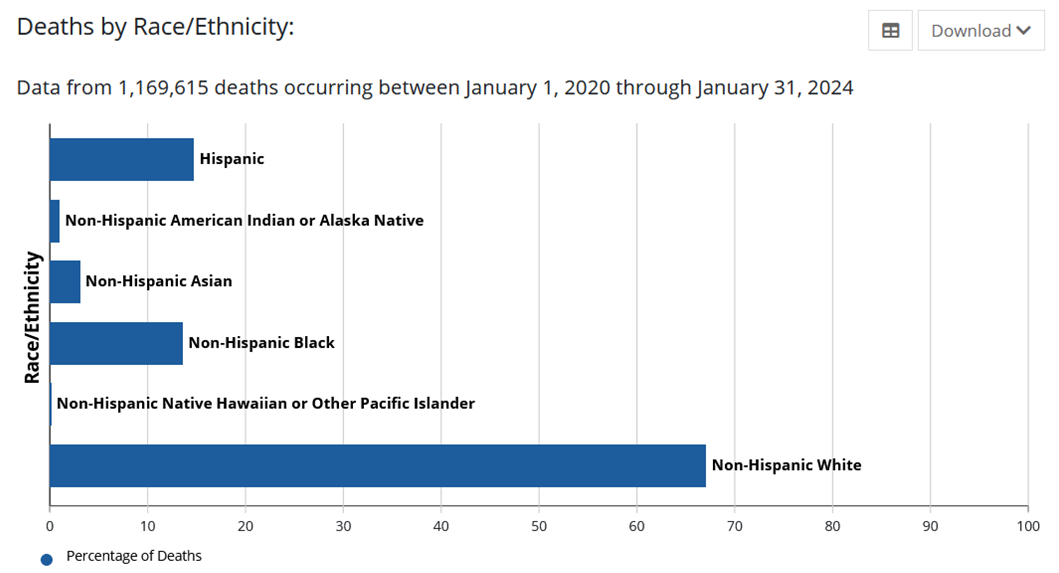 Total deaths by background, 2020-2024
- Latinos: 173,088 have died due to COVID-19
- Blacks: 159,760
- Whites: 785,409
- Asians: 36,716
- American Indian/Alaska Native: 12,300
- Native Hawaiian/Pacific Islander: 2,342
“This is robbing the Hispanic community of a generation of mothers and fathers and brothers and sisters,” Dr. Peter Hotez of Baylor College of Medicine told TPR. Hotez and María Elena Bottazzi created the Corbevax vaccine for COVID-19.
COVID-19 Death Rates for Latinos by Age
Death rates by age and background were last updated on Sept. 27, 2023, on the CDC’s web page.
As of the last update:
Ages 0-24
- Latinos: 29% distribution of COVID-19 deaths
- Blacks: 24.7%
- Whites: 37.8%
- Asians: 3.3%
- American Indian/Alaska Native: 2.1%
- Native Hawaiian/Pacific Islander: 0.7%
Ages 25-34
- Latinos: 30.6% distribution of COVID-19 deaths
- Blacks: 23.9%
- Whites: 36.9%
- Asians: 3.3%
- American Indian/Alaska Native: 3.2%
- Native Hawaiian/Pacific Islander: 0.8%
Ages 35-44
- Latinos: 32.1% distribution of COVID-19 deaths
- Blacks: 21.8%
- Whites: 38.8%
- Asians: 2.9%
- American Indian/Alaska Native: 2.6%
- Native Hawaiian/Pacific Islander: 0.7%
Ages 45-54
- Latinos: 28.1% distribution of COVID-19 deaths
- Blacks: 19.8%
- Whites: 45.7%
- Asians: 2.8%
- American Indian/Alaska Native: 2%
- Native Hawaiian/Pacific Islander: 0.5%
Ages 54-64
- Latinos: 21.3% distribution of COVID-19 deaths
- Blacks: 18.7%
- Whites: 54.4%
- Asians: 2.8%
- American Indian/Alaska Native: 1.6%
- Native Hawaiian/Pacific Islander: 0.3%
 Ages 65-74
- Latinos: 15.8% distribution of COVID-19 deaths
- Blacks: 16.1%
- Whites: 62.7%
- Asians: 3.2%
- American Indian/Alaska Native: 1.2%
- Native Hawaiian/Pacific Islander: 0.2%
Ages 75-84
- Latinos: 11.9% distribution of COVID-19 deaths
- Blacks: 11.7%
- Whites: 71.8%
- Asians: 3.1%
- American Indian/Alaska Native: 0.8%
- Native Hawaiian/Pacific Islander: 0.1%
Ages 85+
- Latinos: 8.8% distribution of COVID-19 deaths
- Blacks: 8.5%
- Whites: 78.5%
- Asians: 3.4%
- American Indian/Alaska Native: 0.4%
- Native Hawaiian/Pacific Islander: 0.1%
COVID-19 Death Rates for Latinos by State
CDC also archived its data on state distribution of COVID-19 deaths by background on Sept. 27, 2023.
As of April 26, 2023:
Alabama (4.4% of total state population is Latino)
- 1.8% Latino distribution of COVID-19 deaths.
- 4.2% Latino distribution of COVID-19 deaths, when weighted for geographic outbreak areas.
Alaska (7.3% of total state population is Latino)
- 3.4% Latino distribution of COVID-19 deaths.
- 8.9% Latino distribution of COVID-19 deaths, when weighted for geographic outbreak areas.
Arizona (31.6% of total state population is Latino)
- 27.4% Latino distribution of COVID-19 deaths.
- 31.8% Latino distribution of COVID-19 deaths, when weighted for geographic outbreak areas.
Arkansas (7.7% of total state population is Latino)
- 3.3% Latino distribution of COVID-19 deaths.
- 9.4% Latino distribution of COVID-19 deaths, when weighted for geographic outbreak areas.
California (39.3% of total state population is Latino)
- 41.8% Latino distribution of COVID-19 deaths.
- 46% Latino distribution of COVID-19 deaths, when weighted for geographic outbreak areas.
Colorado (21.7% of total state population is Latino)
- 22.9% Latino distribution of COVID-19 deaths.
- 22.9% Latino distribution of COVID-19 deaths, when weighted for geographic outbreak areas.
Connecticut (16.5% of total state population is Latino)
- 10.4% Latino distribution of COVID-19 deaths.
- 19.4% Latino distribution of COVID-19 deaths, when weighted for geographic outbreak areas.
Delaware (9.5% of total state population is Latino)
- 3.9% Latino distribution of COVID-19 deaths.
- 10.2% Latino distribution of COVID-19 deaths, when weighted for geographic outbreak areas.
D.C. (11.3% of total state population is Latino)
- 10.9% Latino distribution of COVID-19 deaths.
- 11.4% Latino distribution of COVID-19 deaths, when weighted for geographic outbreak areas.
Florida (26.1% of total state population is Latino)
- 21.5% Latino distribution of COVID-19 deaths.
- 38.9% Latino distribution of COVID-19 deaths, when weighted for geographic outbreak areas.
Georgia (9.8% of total state population is Latino)
- 4.6% Latino distribution of COVID-19 deaths.
- 11% Latino distribution of COVID-19 deaths, when weighted for geographic outbreak areas.
Hawaii (10.7% of total state population is Latino)
- 7.4% Latino distribution of COVID-19 deaths.
- 10.3% Latino distribution of COVID-19 deaths, when weighted for geographic outbreak areas.
Idaho (12.8% of total state population is Latino)
- 7.8% Latino distribution of COVID-19 deaths.
- 11% Latino distribution of COVID-19 deaths, when weighted for geographic outbreak areas.
Illinois (17.4% of total state population is Latino)
- 13% Latino distribution of COVID-19 deaths.
- 24.9% Latino distribution of COVID-19 deaths, when weighted for geographic outbreak areas.
Indiana (7.1% of total state population is Latino)
- 3.6% Latino distribution of COVID-19 deaths.
- 10.8% Latino distribution of COVID-19 deaths, when weighted for geographic outbreak areas.
Iowa (6.2% of total state population is Latino)
- 2.8% Latino distribution of COVID-19 deaths.
- 7.7% Latino distribution of COVID-19 deaths, when weighted for geographic outbreak areas.
Kansas (12.1% of total state population is Latino)
- 7.5% Latino distribution of COVID-19 deaths.
- 13.1% Latino distribution of COVID-19 deaths, when weighted for geographic outbreak areas.
Kentucky (3.8% of total state population is Latino)
- 1.2% Latino distribution of COVID-19 deaths.
- 5.8% Latino distribution of COVID-19 deaths, when weighted for geographic outbreak areas.
Louisiana (5.2% of total state population is Latino)
- 2.7% Latino distribution of COVID-19 deaths.
- 6.6% Latino distribution of COVID-19 deaths, when weighted for geographic outbreak areas.
Maine (1.7% of total state population is Latino)
- 0.4% Latino distribution of COVID-19 deaths.
- 2.0% Latino distribution of COVID-19 deaths, when weighted for geographic outbreak areas.
Maryland (10.4% of total state population is Latino)
- 6.6% Latino distribution of COVID-19 deaths.
- 13.1% Latino distribution of COVID-19 deaths, when weighted for geographic outbreak areas.
Massachusetts (12.3% of total state population is Latino)
- 7.5% Latino distribution of COVID-19 deaths.
- 13.2% Latino distribution of COVID-19 deaths, when weighted for geographic outbreak areas.
Michigan (5.2% of total state population is Latino)
- 3.5% Latino distribution of COVID-19 deaths.
- 5.7% Latino distribution of COVID-19 deaths, when weighted for geographic outbreak areas.
Minnesota (5.5% of total state population is Latino)
- 2.6% Latino distribution of COVID-19 deaths.
- 6.7% Latino distribution of COVID-19 deaths, when weighted for geographic outbreak areas.
Mississippi (3.4% of total state population is Latino)
- 1.1% Latino distribution of COVID-19 deaths.
- 3.3% Latino distribution of COVID-19 deaths, when weighted for geographic outbreak areas.
Missouri (4.3% of total state population is Latino)
- 2.2% Latino distribution of COVID-19 deaths.
- 4.8% Latino distribution of COVID-19 deaths, when weighted for geographic outbreak areas.
Montana (4.1% of total state population is Latino)
- 2.5% Latino distribution of COVID-19 deaths.
- 5% Latino distribution of COVID-19 deaths, when weighted for geographic outbreak areas.
Nebraska (11.2% of total state population is Latino)
- 5.8% Latino distribution of COVID-19 deaths.
- 12.3% Latino distribution of COVID-19 deaths, when weighted for geographic outbreak areas.
Nevada (29% of total state population is Latino)
- 20.2% Latino distribution of COVID-19 deaths.
- 31.6% Latino distribution of COVID-19 deaths, when weighted for geographic outbreak areas.
New Hampshire (3.9% of total state population is Latino)
- 2.1% Latino distribution of COVID-19 deaths.
- 5.8% Latino distribution of COVID-19 deaths, when weighted for geographic outbreak areas.
New Jersey (20.6% of total state population is Latino)
- 17.7% Latino distribution of COVID-19 deaths.
- 22.1% Latino distribution of COVID-19 deaths, when weighted for geographic outbreak areas.
New Mexico (49.1% of total state population is Latino)
- 42.1% Latino distribution of COVID-19 deaths.
- 50.4% Latino distribution of COVID-19 deaths, when weighted for geographic outbreak areas.
New York (19.3% of total state population is Latino)
- 9.2% Latino distribution of COVID-19 deaths.
- 16.7% Latino distribution of COVID-19 deaths, when weighted for geographic outbreak areas.
North Carolina (9.6% of total state population is Latino)
- 4.1% Latino distribution of COVID-19 deaths.
- 11.2% Latino distribution of COVID-19 deaths, when weighted for geographic outbreak areas.
North Dakota (4.1% of total state population is Latino)
- 2.1% Latino distribution of COVID-19 deaths.
- 3.4% Latino distribution of COVID-19 deaths, when weighted for geographic outbreak areas.
Ohio (3.9% of total state population is Latino)
- 1.7% Latino distribution of COVID-19 deaths.
- 5.3% Latino distribution of COVID-19 deaths, when weighted for geographic outbreak areas.
Oklahoma (10.9% of total state population is Latino)
- 5.6% Latino distribution of COVID-19 deaths.
- 15.7% Latino distribution of COVID-19 deaths, when weighted for geographic outbreak areas.
Oregon (13.3% of total state population is Latino)
- 7.3% Latino distribution of COVID-19 deaths.
- 13.7% Latino distribution of COVID-19 deaths, when weighted for geographic outbreak areas.
Pennsylvania (7.6% of total state population is Latino)
- 3.6% Latino distribution of COVID-19 deaths.
- 9.4% Latino distribution of COVID-19 deaths, when weighted for geographic outbreak areas.
Rhode Island (15.9% of total state population is Latino)
- 7.7% Latino distribution of COVID-19 deaths.
- 23.2% Latino distribution of COVID-19 deaths, when weighted for geographic outbreak areas.
South Carolina (5.8% of total state population is Latino)
- 2.4% Latino distribution of COVID-19 deaths.
- 6.8% Latino distribution of COVID-19 deaths, when weighted for geographic outbreak areas.
South Dakota (4.2% of total state population is Latino)
- 1.6% Latino distribution of COVID-19 deaths.
- 5.3% Latino distribution of COVID-19 deaths, when weighted for geographic outbreak areas.
Tennessee (5.6% of total state population is Latino)
- 2.3% Latino distribution of COVID-19 deaths.
- 7.2% Latino distribution of COVID-19 deaths, when weighted for geographic outbreak areas.
Texas (39.6% of total state population is Latino)
- 39.5% Latino distribution of COVID-19 deaths.
- 44.6% Latino distribution of COVID-19 deaths, when weighted for geographic outbreak areas.
Utah (14.2% of total state population is Latino)
- 12.5% Latino distribution of COVID-19 deaths.
- 17.1% Latino distribution of COVID-19 deaths, when weighted for geographic outbreak areas.
Vermont (2% of total state population is Latino)
- 0% Latino distribution of COVID-19 deaths.
- 2.4% Latino distribution of COVID-19 deaths, when weighted for geographic outbreak areas.
Virginia (9.6% of total state population is Latino)
- 4.9% Latino distribution of COVID-19 deaths.
- 12.3% Latino distribution of COVID-19 deaths, when weighted for geographic outbreak areas.
Washington (12.9% of total state population is Latino)
- 8.5% Latino distribution of COVID-19 deaths.
- 11.1% Latino distribution of COVID-19 deaths, when weighted for geographic outbreak areas.
West Virginia (1.7% of total state population is Latino)
- 0.5% Latino distribution of COVID-19 deaths.
- 1.8% Latino distribution of COVID-19 deaths, when weighted for geographic outbreak areas.
Wisconsin (6.9% of total state population is Latino)
- 4.2% Latino distribution of COVID-19 deaths.
- 11.4% Latino distribution of COVID-19 deaths, when weighted for geographic outbreak areas.
Wyoming (10.1% of total state population is Latino)
- 8.2% Latino distribution of COVID-19 deaths.
- 11.3% Latino distribution of COVID-19 deaths, when weighted for geographic outbreak areas.
That means 40 of 50 reporting states and D.C. have more Latino deaths, according to the weighted CDC data.
COVID-19 Case and Death Data in 5 U.S. Cities with Largest Latino Populations
Here is a look at COVID-19 rates by background in the most Latino cities.
1. New York City
29.1% of the total population is Latino.
Latinos have the largest number of cases per 100,000 people due to COVID-19.
COVID-19 Cumulative Case Rate per 100,000 People
- Hispanics/Latinos: 39,325
- Asians: 33,468
- Whites: 32,894
- Blacks: 31,155
COVID-19 Cumulative Hospitalization Rate per 100,000 People
- Hispanics/Latinos: 2,845
- Asians: 1,508
- Whites: 1,693
- Blacks: 2,961
Source: NYC Health, accessed 3/5/24 via the “Totals” tab.
2. Los Angeles County (Home of Los Angeles)
48.6% of the total population is Latino.
Latinos currently comprise over half of the county’s COVID-19 cases by background:
- Hispanics/Latinos: 1,553,191
- Blacks: 196,852
- Whites: 517,105
- Asians: 275,605
- American Indian/Alaska Native: 6,968
- Native Hawaiian/Pacific Islander: 18,281
Source: County of Los Angeles Public Health, as of Feb. 29, 2024 (accessed March 5, 2024).
3. City of Houston
44.8% of the total population is Latino.
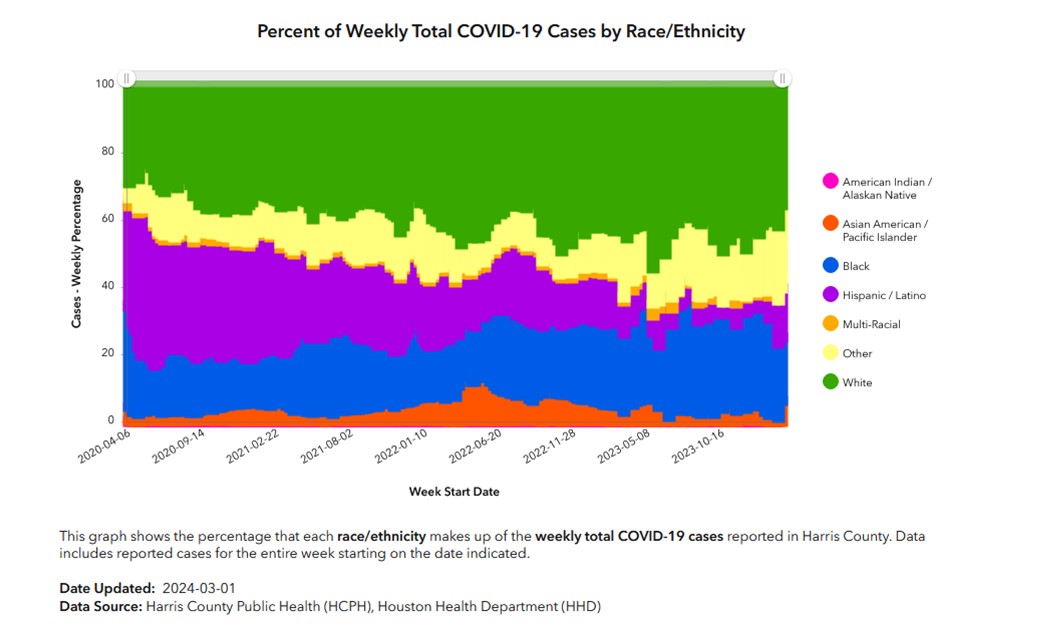 Latinos comprised a large percentage of COVID-19 cases at the outset of the pandemic, but their share of cases has declined over time.
% of Weekly Total COVID-19 Cases by background
- Hispanics/Latinos: 14.6%
- Blacks: 18.8%
- Whites: 35.4%
- Asians: 6.3%
- Other: 25%
Source: Harris County data, as of March 1, 2024 (accessed March 5, 2024).
4. Bexar County (Home of San Antonio)
60% of the total population is Latino.
70% of COVID-19 cases were Latino, as of March 4, 2022.
“Among cases for whom [background] data are available, Hispanic individuals continue to make up the majority of total COVID-19 cases. Although Hispanics make up 60% of the Bexar County population, they represent 70% of cases with known [background],” according to the San Antonio Metropolitan Health District’s latest monthly epidemiological report.
Source: San Antonio Metropolitan Health District Monthly Epidemiological Report, last available 3/4/22. As of 1/20/23, the district is no longer reporting epidemiological reports and school case numbers.
5. City of Chicago
29% of the total population is Latino.
Most COVID-19 cases, cumulatively from 2020 to 2024, are among Latinos.
Number of COVID-19 cases, cumulatively from 2020 to 2024:
- Hispanics/Latinos: 225,798
- Blacks: 195,841
- Whites: 210,834
- Asians:37,483
- Other:42,554
- Unknown: 106,437
Source: Chicago.gov, as of Feb. 23, 2024 (accessed March 5, 2024).
Latino ‘Excess Deaths’ Far Exceed Initial Estimates during COVID-19 Pandemic
Annually, CDC researchers compile and analyze data to predict the number of deaths that will occur in the coming year.
 The number of mortalities that go over this initial estimate, or “the difference between the observed numbers of deaths in specific time periods and expected numbers of deaths in the same time periods,” are known as excess deaths.
Looking at deaths in 2020 compared with predicted deaths, researchers found that U.S. Latinos suffered double the excess deaths per 100,000 people than their white peers.
With COVID-19 as a cause, excess deaths per 100,000 persons from March to December 2020 among Blacks and Latinos were more than double those among whites
“There were profound [background differences] in excess deaths in the United States in 2020 during the COVID-19 pandemic, resulting in rapid increases in [background differences] in all-cause mortality between 2019 and 2020,” according to an October 2021 study published in Annals of Internal Medicine.
What Does All This Coronavirus Case and Death Data Really Mean?
It means Latino faced a heavy burden of COVID-19.
Latinos are highly exposed to the virus as essential workers.
Also, this population suffers from differences in income, health care access, access to food, and more. Poverty rates also play a large role, as do fears of impact on daily life.
Latino undocumented immigrants often don’t benefit from unemployment aid or stimulus checks, either.
But we can overcome our recognitions.
We also need policies to address support for Latinos in poverty, such as these 10 strategies.
“Capable and healthy adults are the foundation of any well-functioning society,” said Greg Duncan of University of California, Irvine, in a news release. “But because millions of American children are in families living below the poverty line, this future is not as secure as it could be.”
Latinos Getting Vaccinated for COVID-19, But Some Still Resist Vaccines
Initially in the pandemic, Latinos made up a very low percentage of those getting a vaccine, despite being hurt by COVID-19.
Lack of access and vaccine hesitancy might be part of the reason. Learn five important ways to build trust and address vaccine hesitancy.
However, in between July and September 2021, data show that more and more Latinos are getting vaccinated, even surpassing the number for Black and white people, according to the Kaiser Family Foundation.
To help move Latinos from vaccine hesitancy to vaccine confidence, Salud America! is uplifting the stories of real Latinos who overcame incorrect information, got the COVID-19 vaccine (Pfizer-BioNTech, Moderna, Johnson & Johnson), reconnected with family, and helped end the pandemic.
For example, take Rosa Herrera.
Rosa read on Facebook that the COVID-19 vaccine would inject her with a microchip.
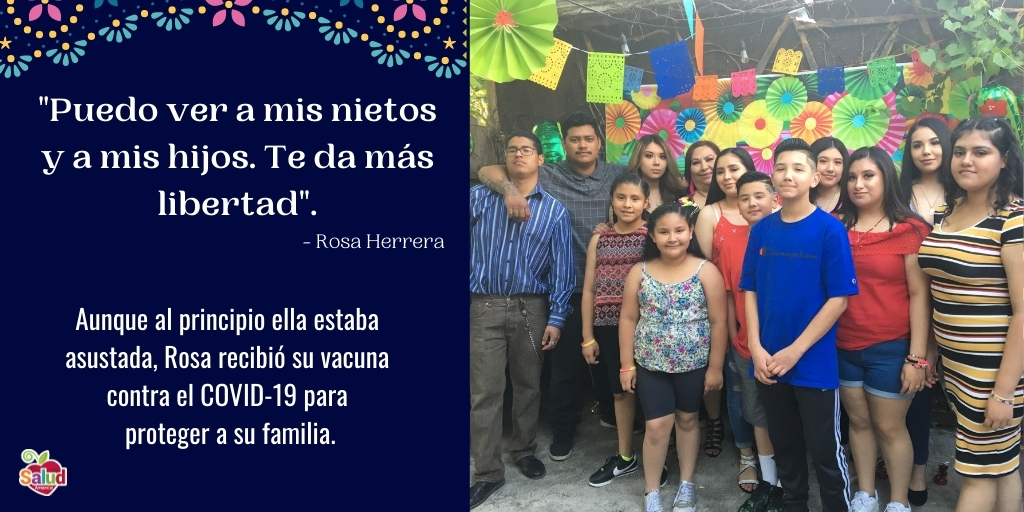 What changed her heart? After doing research and learning that the vaccine is safe, she ultimately decided to get a vaccine.
She’s glad she did.
“I’m able to see my grandkids and my kids here. It gives you more freedom,” Herrera said.
SHARE VACCINE CONFIDENCE STORIES
What Can You Do?
Check out how coronavirus is impacting Latinos. Here are 19 ways to push for health improvement amid coronavirus.
You can also get a “Report Card” for your area!
Select your county name and get a customized Report Card by Salud America! at UT Health San Antonio. You will see how your area stacks up in housing, transit, poverty, health care, healthy food, and other health issues compared to the rest of your state and nation.
Also, take a personal step to ensure the safety of our communities.
See and share our Salud America! “Juntos, We Can Stop COVID-19” digital communication campaign in English or Spanish to help Latino families and workers take action to slow the spread of coronavirus, including getting the vaccine (when available).
The #JuntosStopCovid campaign features culturally relevant fact sheets, infographics, and video role model stories to encourage Latinos to change their public health behaviors.
By The Numbers
142
Percent
Expected rise in Latino cancer cases in coming years