
Share On Social!
Wonder how much the environment is impacting health in your city?
Use the CDC’s newest tool – the Environmental Justice Index (EJI) – to get a single environmental justice score for your community.
The EJI measures the cumulative impacts of environmental burden through the lens of human health and health equity. It uses data from the CDC, U.S. Census Bureau, the U.S. Environmental Protection Agency, and the U.S. Mine Safety and Health Administration.
CDC officials hope public health officials use the EJI score to identify and map areas most at risk for the health impacts of environmental burden.
“Social factors such as poverty, race, and ethnicity, along with pre-existing health conditions may increase these [environmental] impacts,” according to the CDC. “This tool helps public health officials prioritize action for those communities most at need.”
What is Environmental Justice?
The CDC defines environmental justice as the fair treatment and meaningful involvement of all people, regardless of race, color, national origin, or income, to develop, implement, and enforce environmental laws, regulations, and policies.
“This goal will be achieved when everyone enjoys the same degree of protection from environmental and health hazards, and equal access to the decision-making process to live, learn, and work in a healthy environment,” according to the CDC.
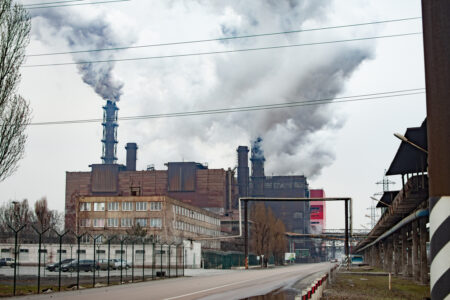
The lack of environmental justice can be caused by factors such as pollution, poor environmental conditions, pre-existing health conditions, access to quality healthcare.
With contributors such as Superfund Sites and unequal impact of climate change, many Latinos face environmental injustice on a daily basis.
“Too many communities across our nation, particularly low-income communities and communities of color, continue to bear the brunt of pollution. Meeting the needs of these communities requires our focused attention and we will use the Environmental Justice Index to do just that,” said Health and Human Services Secretary Xavier Becerra in a CDC press release.
A Salud America! resource reported on a 2019 study that estimated Black and Latino populations experience 56% and 63% more pollution respectively than their activities cause.
“Latino workers are more likely to serve in construction, agricultural and food production industries — all of which are susceptible to greater job losses and higher workplace injuries that are directly attributable to impacts from climate change,” according to an article from Latino Rebel.
Purpose of the Environmental Justice Index
CDC’s EJI tool can be used for many things, including:
- Identifying and prioritizing areas that may require special attention or additional action to improve health and health equity.
- Educating and informing the public about their community.
- Analyzing the unique, local factors driving cumulative impacts on health to inform policy and decision-making.
- Establishing meaningful goals and measure progress towards environmental justice and health equity.
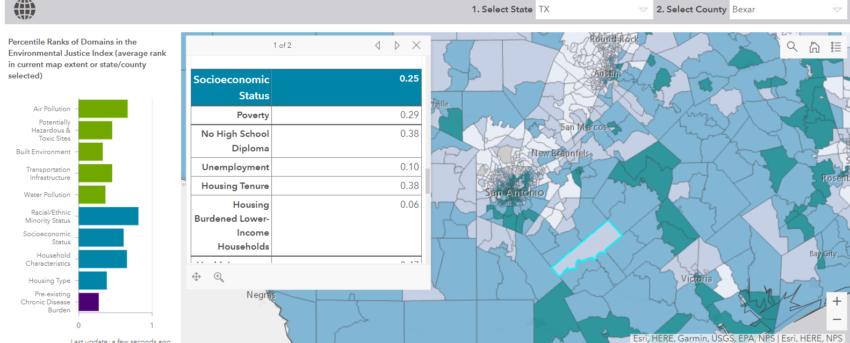
The EJI explorer allows users to select specific states, counties and geographic locations and view the ranked domains by different modules. The modules include:
- Environmental Burden
- Social Vulnerability
- Health Vulnerability
Users can find domain rankings in their area such as air pollution, unemployment, and high prevalence of poor mental health.
An example of environmental burden and cumulative impacts would be a community with few native English speakers and little representation in local government who already face high rates of asthma and poor air quality.
“People in this community weren’t able to engage with the announcement of a manufacturing plant relocating to their area. Information about the manufacturing plant was not available in their preferred language,” according to the CDC. “Ten years later, children in middle school may be getting sick and families may find that the plant has been leaking chemicals into their local water source. These families may not have health insurance or financial resources to pay for the medical treatment their children need, and their children’s medical issues may have gotten worse over time, with asthma and poor air quality compounding the issues caused by the pollution of the drinking water.”
Health Equity Report Card
The CDC’s EJI tools is a high-level mapping and screening tool that characterizes cumulative impacts and patterns of environmental injustice across the U.S.
You can also find out other health equity impacts in your area.
Download your community’s Health Equity Report Card from Salud America! to see the health-related conditions and data in your county.
The Report Card will help you visualize and explore inequities in your surrounding community, such as housing, healthcare, and environmental issues.
See how your county compares to other across the state and the nation. You can share the Report Card with your local leaders to advocate for healthy change!
By The Numbers
24
percent
of Mexican American-nonsmokers are exposed to secondhand smoke