Share On Social!
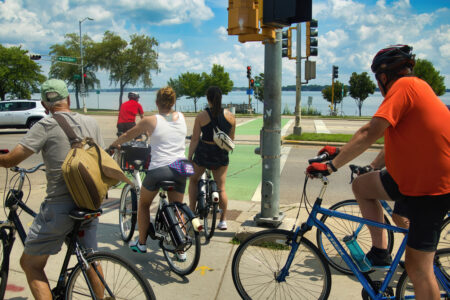
Our roads and walkways could be our path to good health and wellbeing.
But cities are stuck in a rut of prioritizing cars over people.
Thankfully, over the past decade, many organizations are contributing to the growing body of health and safety research and advocacy to influence transportation projects and policies.
Knowing the Impact
In 2012, the Robert Wood Johnson Foundation released a research brief and infographic on how transportation affects health.
“Health costs associated with traffic crashes, air pollution, and physical inactivity add up to hundreds of billions of dollars each year, but health is typically not considered in transportation policy and planning,” the 2012 Health Policy Snapshot Issue Brief states.
Changing the Speed Limit
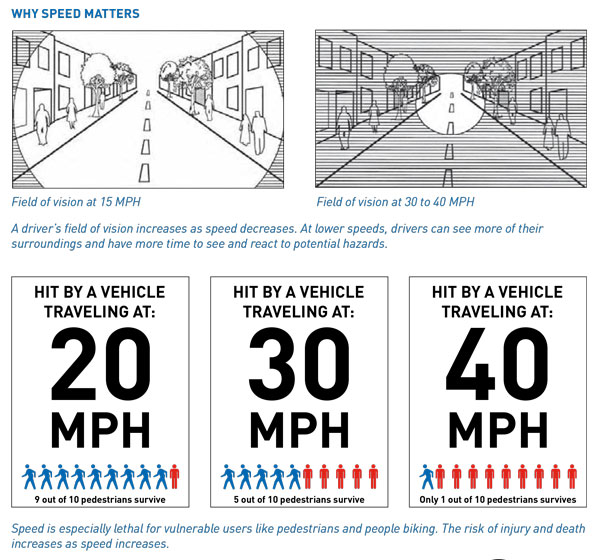 In 2011, the AAA Foundation for Traffic Safety released a report on Impact Speed and a Pedestrian’s Risk of Severe Injury or Death.
This data has been used by many individuals, agencies and organizations, like Streetsblog USA, ProPublica, and the Vision Zero Network, to demonstrate the impact speed has on pedestrian safety and advocate for lower speeds.
Using Datasets to Change Transit Systems
The U.S. Department of Transportation (USDOT) and the Centers for Disease Control and Prevention (CDC) released the Transportation and Health Tool in 2015 to provide easy access to data that practitioners can use to examine the health impacts of transportation systems.
The tool has a dataset of 14 transportation and public health indicators to help states, metropolitan areas and/or urbanized areas describe how the transportation environment affects safety, active transportation, air quality, connectivity to destinations, and equity.
The tool also provides evidence-based policies, strategies, and interventions that transportation practitioners can use to address health, like Complete Streets, traffic calming to slow vehicle speeds, and expanding public transportation, bicycle, and pedestrian infrastructure.
Reports on Beneficial Transportation Programs
Safe Routes to School National Partnership’s 2015 report, At the Intersection of Active Transportation and Equity, explores efforts to advance active transportation to increase health, fairness and opportunity.
Then also offer information on Using the Transportation Alternatives Program (TAP) to Improve Safety and Health in Your Community.
The Transportation Research Board (TRB) developed a special issue for their bimonthly magazine, TR News, to address the connections between public health and transportation. Released in 2015, the edition, Public Health and Transportation: Innovation, Intervention and Improvements, features the health impacts of transportation decisions, way transportation professionals can connect with the public health community and more.
Policies that Have Potential
The American Public Health Association and Transportation for America developed a policy paper in 2017, outlining four policy levers for metropolitan planning organizations (MPOs) to prioritize health in their plans, projects, and policies to decrease health disparities, increase access to opportunities, and strengthen local economies.
They also include five case studies of real-life success strategies.
For example, the Nashville Area MPO dedicated 15% of its Urban Surface Transportation program (STP) to bicycling, walking, and transit-supportive projects, and the Sacramento Area council of Governments (SACOG) uses a robust set of 20 performance measures to select transportation projects.
One measure is used to evaluate how a proposed project would change bike and walk mode share in Environmental Justice areas.
Cost-Saving Calculators
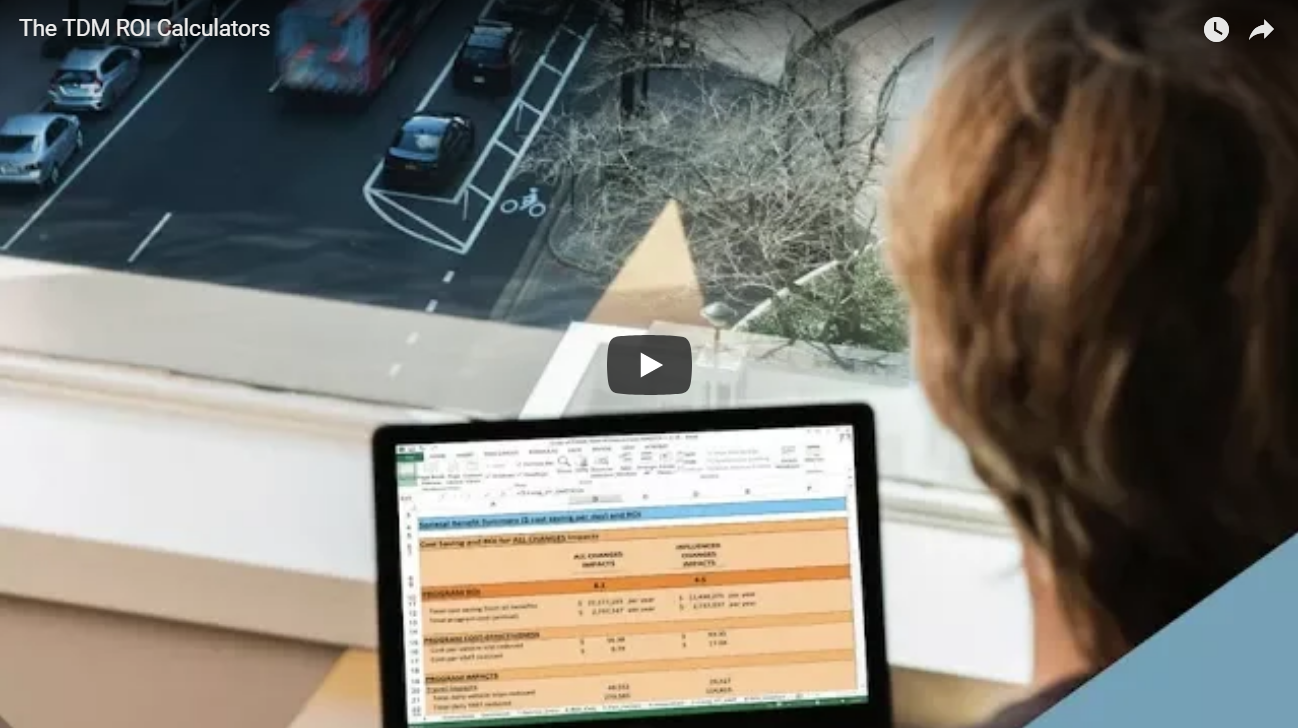
In July 2018, Mobility Lab Team released a pair of calculators to make the business case for economically valuable transportation demand management (TDM) programs are in your area or region.
The Transportation Cost-Savings Calculators are free for TDM professionals, planners, and departments of transportation to quantify the return on investment (ROI) from TDM programs in local economics and measure results in seven ways:
- air pollution reduction
- climate change mitigation
- hours of traffic congestion delay reduced
- new road construction deferred by lane miles
- fuel saved
- crashes avoided
- vehicle noise pollution reduced.
For example, 45,000 vehicle trips and 900,000 miles of travel are taken of the roads each workday by the TDM programs in Arlington County, Virginia. This defers 14 lane miles of road construction and saves commuters, society, and government of up to $75 million a year.
In fact, for every $1 invested in Arlington County’s TDM, there is a $9 in return on investment.
Action Campaigns
The #SlowTheCars Campaign launched in 2015 by Charles Marohn of Strong Towns to raise awareness about how dangerous design threatens the safety and prosperity of streets.
Marohn, a professional engineer, shares resources to help elected officials and transportation engineers and planners design and implement safer, more productive streets. Moreover, reducing the speed by five miles per hour will only add about one minute to the average commute.
“In short, a simple sidewalk could serve millions of people traveling on foot for decades, even centuries, with only a small amount of up-front investment and minimal maintenance costs for the city — yet it would support dozens or hundreds of local businesses,” wrote Rachel Quednau of Strong Towns. “The same length of street designed primarily for cars would cost exponentially more to build and keep up and would only serve a handful of businesses.”
In Marohn’s “Gross Negligence” series, he examines the root cause of America’s dangerously designed roads, which take tens of thousands of lives every year.
Marohn doesn’t blame humans for making mistakes while driving. He blames the people who took 70 mph highway standards and applied them to streets in urban neighborhoods, and he goes so far to call it gross negligence.
“The engineering profession has a moral obligation to lead the effort to address this problem,” Marohn writes.
What Can You Do?
Are you concerned about air pollution, obesity, diabetes, climate change, traffic congestion delay, inequitable access to education and employment opportunities, inequitable access to healthy food and safe places to walk and play, costs for new road construction, costs for road maintenance, fuel costs, traffic and pedestrian crashes, and/or vehicle noise pollution?
Share the above resources with your health department, friends, and colleagues. Check out this communication guide for talking health and climate.
We can’t build a culture of health if transportation policy and planning continue to disregard and/or misunderstand the needs of people who walk, bike and take public transit.
“Dangerous roads do not make productive use of our land or our lives,” Marohn writes.
By The Numbers
27
percent
of Latinos rely on public transit (compared to 14% of whites).