
Share On Social!
It is no coincidence that the region that has the highest percentage of Non-White students (90%) is also 11.7 times more likely to discipline their Black students than their White students, as data shows in ProPublica research.
Worse, the District of Columbia is also 3.7 times more likely to discipline their Latino students than their White students.
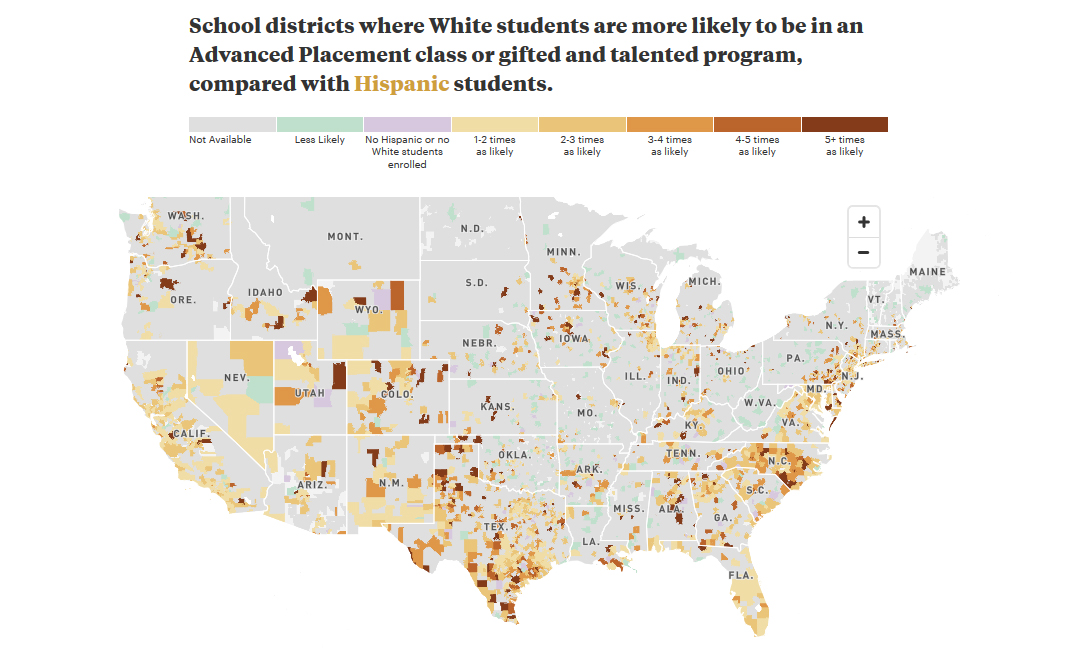
There are many other factors to consider when discussing racial inequity. Miseducation recently published an interactive map graphic that allows users to seek out their school district and compare it to others all over the U.S., using information from the United States Department of Education’s civil rights data.
This data covers school districts that are currently under Desegregation Orders. As of 2018, there are more than 50 million students in the school districts that are under the Desegregation Order.
Why Are These Trends Still Around?
This may be due to the fact that Latino and Black populations tend to still be of a lower socioeconomic status than White populations. Let it be noted that it has become much more complex than ever before.
In Colorado (21.7% Latino), for instance, new teachers that are just beginning their careers tend to work in districts that are lower income. When there is an unequal balance of teachers that do not have enough experience, it makes sense that the teacher will not have the ability to give their students the best education possible.
 This situation is not special in any way shape or form. Lower-income families are only one piece of the puzzle.
There are other situations to take into account.
“Latino kids and other kids of color face more adversity and toxic stress at home and in their community. They face harsher and more frequent punishment in school than their white peers,” according to Salud America!‘s Amanda Merck.
School-age children face battles in different aspects of their lives, some more than others.
Some Evidence of the disparities according to the researchers from the journal ProPublica.
- White students are nearly 3 times as likely to be in Advanced Placement classes compared to their Latino peers in states such as Connecticut (16.5%), Hawaii (10.7%), and Pennsylvania (7.6%)
- In South Carolina (5.7%), White students are 3.2 times more likely to be in AP classes compared to Black students
- Latino students are more than 3 times as likely to be suspended compared to their White peers in states Connecticut, Massachusetts (12.3%), Pennsylvania, and District of Columbia (11.3%)
- Across the U.S. Latino students are 1.3 times less likely to be in an Advanced Placement class compared to White students
This evidence of how racial inequalities can have a significant impact on our education system.
How Important are Exam Scores?
This project even embraces the fact that test scores seem to also be an area full of disparities.
“But on the AP tests as well, there is a clear racial and ethnic gap, with 72% of Asian test takers earning at least one three, compared to 66% of white students, 50% of Latino students, 46% of Native American students and 32% of black students,” says Scott Jaschik, founder of Inside Higher Ed.
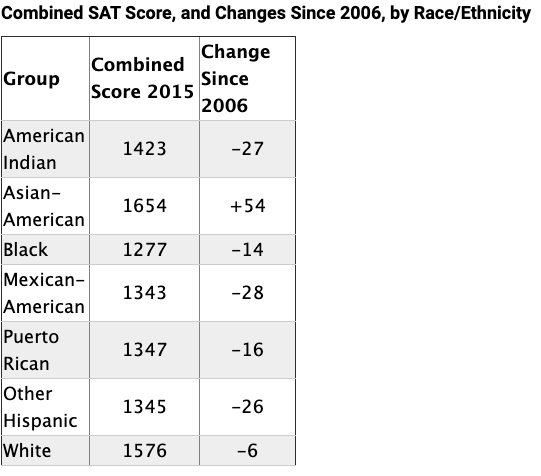
There is also a prevalence of Latino and Black students who have SAT scores lower than Non-Latino White and Asian students. This graph provided by the College Board indicates that Latino and Black test scores are going down at an alarming rate.
SAT scores and AP Exam scores will be extremely important if students plan on going into higher education. Having a college degree will inevitably lead to a higher socioeconomic status.
In turn, a higher socioeconomic status can be a key factor in breaking the cycle of racial inequality.
It is important to dig deeper into the situations that may have caused the low exam scores. These are the environmental factors that lead to Latino students performing poorly on exams that can determine their future, such as AP and the SAT.
Can I Look at My School District?
There are over 17 thousand school district to take a look at, if your district or school is not on the list, there could be one near you with plenty of information.
All of the districts included in this interactive map fall under Desegregation Orders, whether it be under the federal or state level. These schools will remain in the Desegregation Order until the federal and state court deems it equal for all races and ethnic groups.
When a school district falls under such order, it is their overall goal to remedy the problems to the quality of what the court orders.
Further investigation into the database uncovers the vast amount of information about each school and more details about types of school discipline and opportunity measures. On a lighter note, the fact that this collection of data exists and is being analyzed to this degree is inspiring.
What Can You Do?
Start by downloading the free Salud America! “Handle With Care Action Pack.”
The Action Pack helps police, school, and mental healthcare leaders start the Handle with Care program, in which police notify schools when they encounter children at a traumatic scene, so schools can provide support right away.
From one perspective to another, learn about how Colorado is Reconsidering School Discipline for PreK through Second Grade.
Explore More:
EducationBy The Numbers
142
Percent
Expected rise in Latino cancer cases in coming years