Share On Social!
Traffic fatality rates—in decline for 50 years—are rising again.
Why? Not enough effort to get vehicles off the road, traffic safety experts say.
Reducing vehicle travel can boost safety. It has many social, environmental, and health benefits, too, especially for Latinos who face many transportation barriers.
Yet historical transportation planning had misplaced focus in four keys area: vehicle throughput to sprawling areas, vehicle travel safety over transportation system safety, vehicle safety over roadway safety, and reducing high-risk driving over all driving.
Here is a breakdown of each issue, and why we desperately need reform.
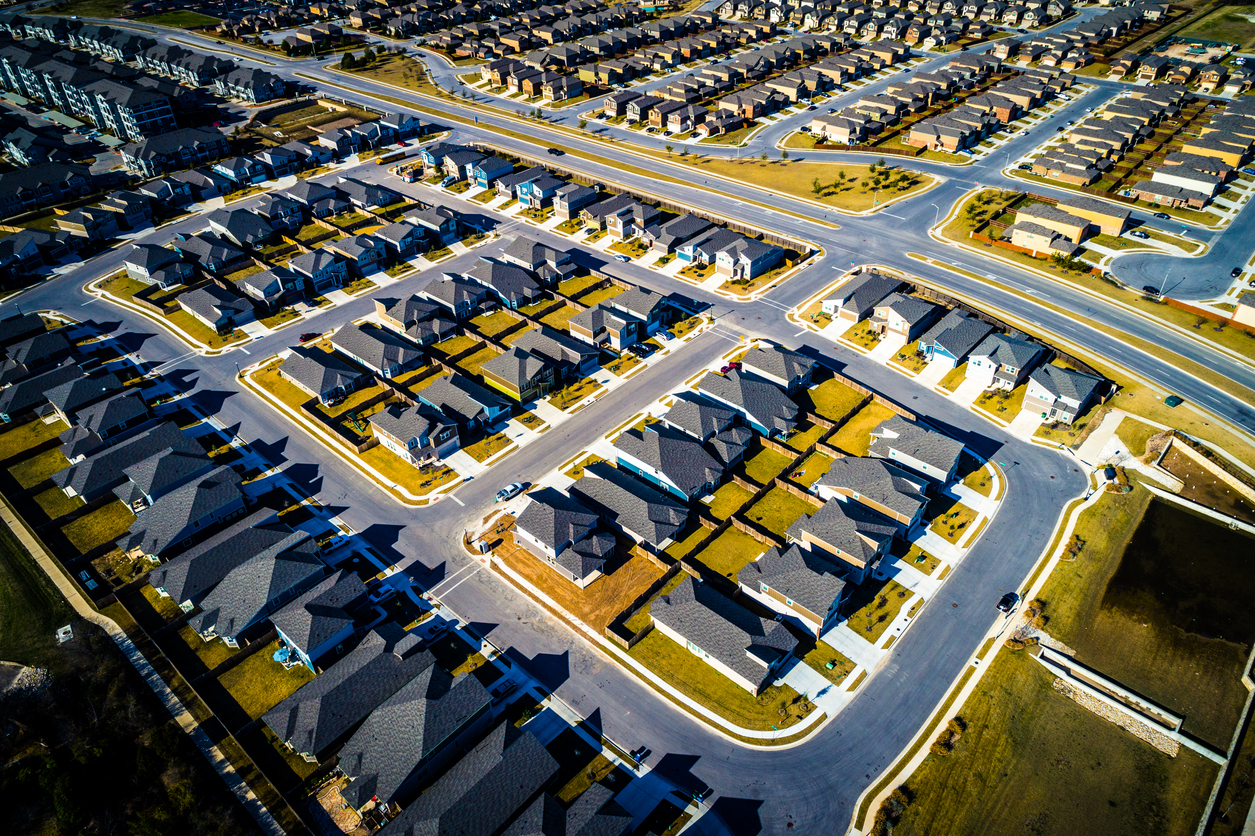
1. Historical Focus on Vehicle Throughput to Sprawling Areas
What is sprawl?
Reid Ewing, a nationally recognized transportation-planning researcher, defines sprawl as:
- a population widely dispersed in low-density residential development;
- a rigid separation of homes, shops and workplaces;
- a lack of major employment and population concentrations downtown and in suburban town centers and other activity centers; and
- a network of roads marked by very large block sizes and poor access from one place to another.
Sprawl can increase human obesity risk, air and water pollution, and energy and water consumption.
It is also associated with higher risk of traffic death.
 That’s because, in sprawling developments, arterial roads (thoroughfares) are often designed for high speeds (45 to 55 mph) and high volumes. This makes them hostile to people walking and biking. They also leave residents with no alternative to vehicle travel.
In 2009, Ewing and researchers developed a Conceptual Framework Linking the Built Environment to Traffic Safety:
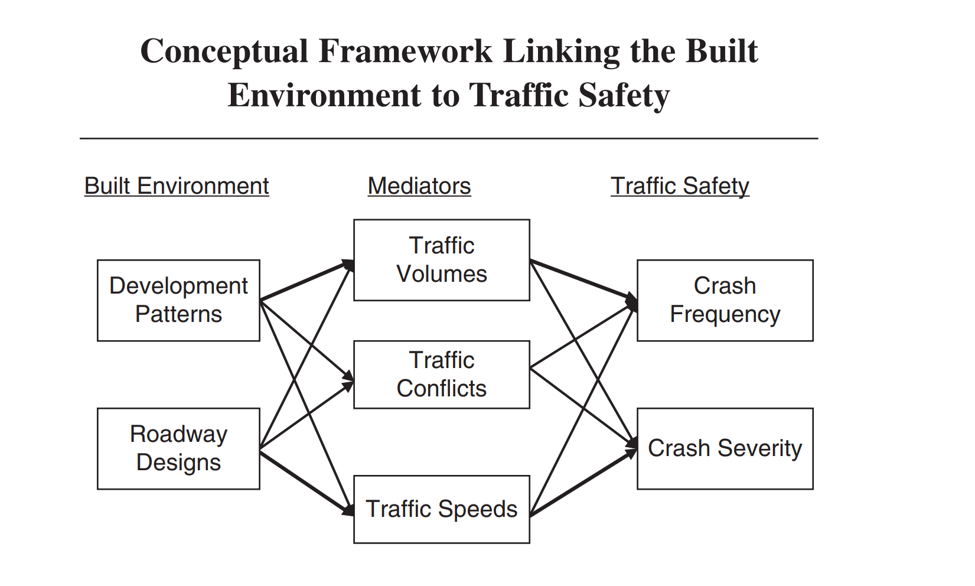
“In this framework, the built environment affects crash frequency and severity through the mediators of traffic volume and traffic speed. Development patterns impact safety primarily through the traffic volumes they generate, and secondarily through the speeds they encourage. Roadway designs impact safety primarily through the traffic speeds they allow, and secondarily through the traffic volumes they generate. Traffic volumes in turn are the primary determinants of crash frequency, while traffic speeds are the primary determinants of crash severity.”
In a 2011 study, researchers found that each additional mile of arterial thoroughfare was associated with a 9.3% increase in motorist-pedestrian crashes. Each additional strip commercial use was associated with a 3% increase in vehicle-pedestrian crashes. Each big box store was associated with an 8.7% increase in vehicle-pedestrian crashes.
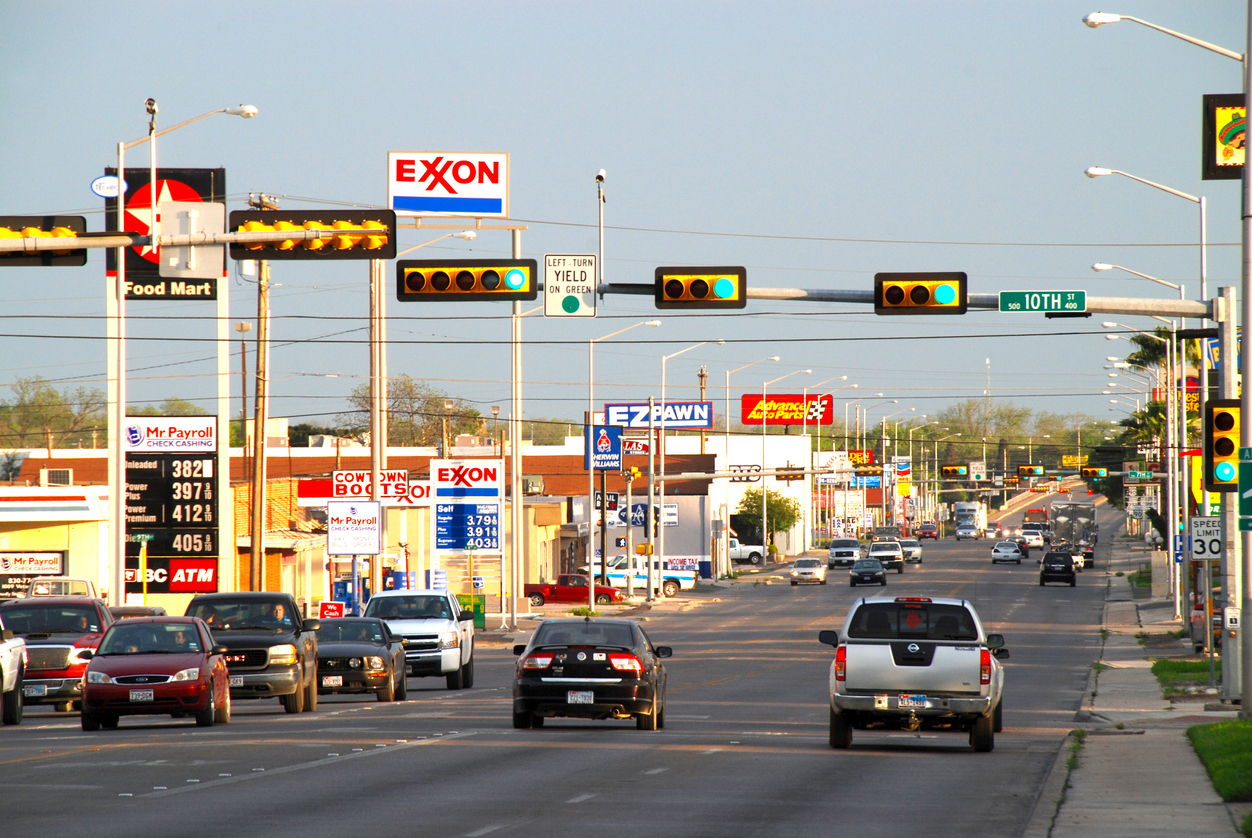
As metropolitan areas grow, previously underdeveloped rural highways are seeing increases in commercial and resident density, thus volume. However, in urban areas in 2018, 78% of vehicle crash deaths occur on arterial roads, according to the Insurance Institute for Highway Safety.
Nearly two in three (65%) vehicle crash deaths in urban areas occur on roads with speed limits below 55 mph. In rural areas, 72% of vehicle crash deaths occur on roads with speed limits of 55 mph or higher.
From 2009 to 2016, pedestrian deaths increased 54% in urban areas compared to 25% in rural areas and 67% on arterials, compared to 9% on collectors and local roads.
In a 2016 study, researchers found that sprawling metros and sprawling counties have significantly higher traffic fatality rates than compact counties.
In this study, researchers looked at 994 metropolitan counties in the US and found that sprawl is both directly and indirectly a significant factor for traffic fatalities. The direct effect is likely due to the higher traffic speeds, and the indirect effect is due to greater vehicle miles driven.
Applying “forgiving” roadway design, like wide lanes and low intersection density, is suitable for undeveloped rural areas, but not for metropolitan areas.
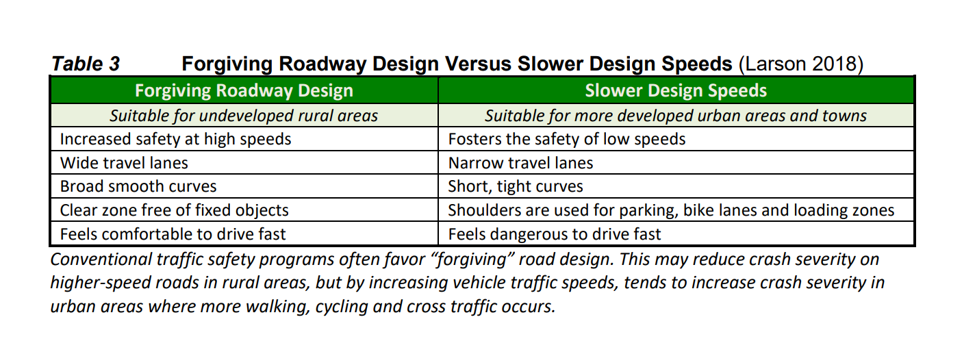 “In dense urban areas, less-‘forgiving’ design treatments—such as narrow lanes, traffic-calming measures, and street trees close to the roadway—appear to enhance a roadway’s safety performance when compared to more conventional roadway designs,” according to Ewing.
Urban areas can achieve significant safety gains—within a few years—by applying Smart Growth principles:
- Mix land uses
- Take advantage of compact design
- Create a range of housing opportunities and choices
- Create walkable neighborhoods
- Foster distinctive, attractive communities with a strong sense of place
- Preserve open space, farmland, natural beauty, and critical environmental area
- Direct development towards existing communities
- Provide a variety of transportation choices
- Make development decisions predictable, fair, and cost effective
- Encourage community stakeholder collaboration in development decisions
In fact, during a 10-year period, the cities with multi-modal planning and Smart Growth policies reduced their traffic fatality rates 2.5 times more than in cities with conventional planning and development policies, according to Todd Litman with the Victoria Transport Policy Institute.
Litman compiled more safety benefits:
- More connected and complete streets can reduce local crash fatality rates 10-30%
- Each 1% transit ridership gain typically reduces traffic casualties 1% or more
- HOV and bus traffic priority can reduce affected traveler’s crash rates 10-30%, and total rates 1-5%
- Urban rail and bus rapid transit can reduce crash rates 30-60% in affected areas and 10-30% region-wide
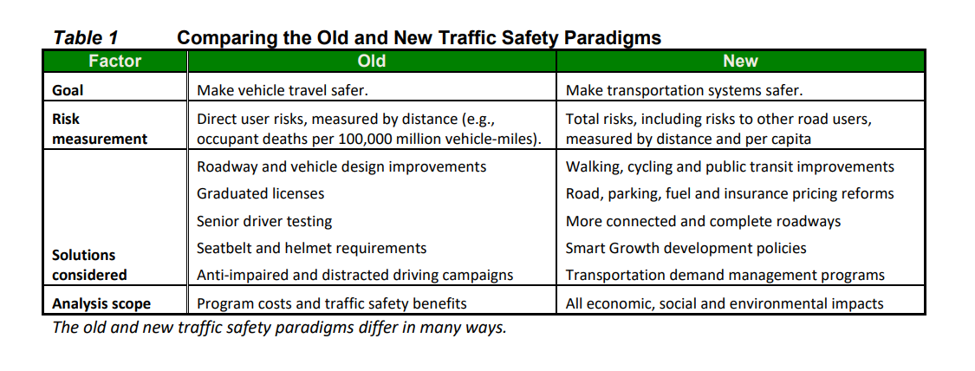
Litman developed an entirely new new traffic safety paradigm with 15 strategies to reduce vehicle travel and crash rates.
To improve safety, metropolitan areas should limit sprawl, reduce vehicle travel, and encourage Smart Growth principles.
2. Historical Focus on Making Vehicle Travel Safer Rather Than Making Transportation Systems Safer
Although occupants inside a vehicle might be safer, other roadway users are not.
The number of people walking struck and killed by people driving increased 34.5% between 2008 and 2017. In Texas, the number of people walking killed by people driving increased 39.5% between 2008-17.
One of the oldest criteria for setting speed limits is not supported by scientific research, but relies on smart choices by 85% of drivers.
The “85th percentile method” roughly says if 85% of people are driving a certain speed, that should be the speed limit.
 For example, if results of a speed survey show that at least 85% of drivers are going 38 mph in a 35 mph zone, the city should raise the speed limit to 40 mph.
Fast forward five years (how long a traffic survey is valid): if at least 85% of drivers are going 43 mph, the speed limit would go up again, to 45 mph.
Other factors, such as pedestrian and bicycle safety, crash reports, business density, and residential density, are not required considerations. In fact, no justification is needed beyond the 85th percentile to raise the speed limit. However, justification is required to reduce the speed limit.
The “85th percentile method” assumes most drivers will choose reasonable and prudent speeds.
However, drivers tend to underestimate their speed by 10-30% according to University of California Institute of Transportation Studies (UC ITS) researchers.
“These research results indicate that drivers are not good at “naturally” selecting safe speeds and suggests that it is not prudent to use driving habits as a basis for establishing speed limits,” according to the report.

Moreover, this method has not been proven to reduce the frequency or severity of crashes.
The method was developed for rural roads, with little development and low density, but is inappropriately applied to roads in urban areas.
“There is not strong evidence that the 85th percentile speed within a given traffic flow equates to the speed with the lowest crash involvement rate for all road types,” according to a 2017 report from the National Transportation Safety Board. “Alternative approaches and expert systems for setting speed limits are available, which incorporate factors such as crash history and the presence of vulnerable road users such as pedestrians.”
To improve safety, states and metropolitan areas should reduce vehicle travel and promote Smart Growth principles.
3. Historical Focus on Making Vehicles Safer Rather than Making Roadways Safer, Until Recently
Safety standards have dramatically improved safety for people inside automobiles.
For example, replacing plate glass windshields with safety glass and requiring collapsible steering columns have saved nearly 100,000 lives since 1960. Seatbelts alone have saved over 330,000 lives in that time.
While seat belts have saved roughly 5,500 lives per year, six times that many continue dying in traffic crashes.
Vehicle safety improvements, however, only protect those inside the vehicle and don’t improve safety for other road users.
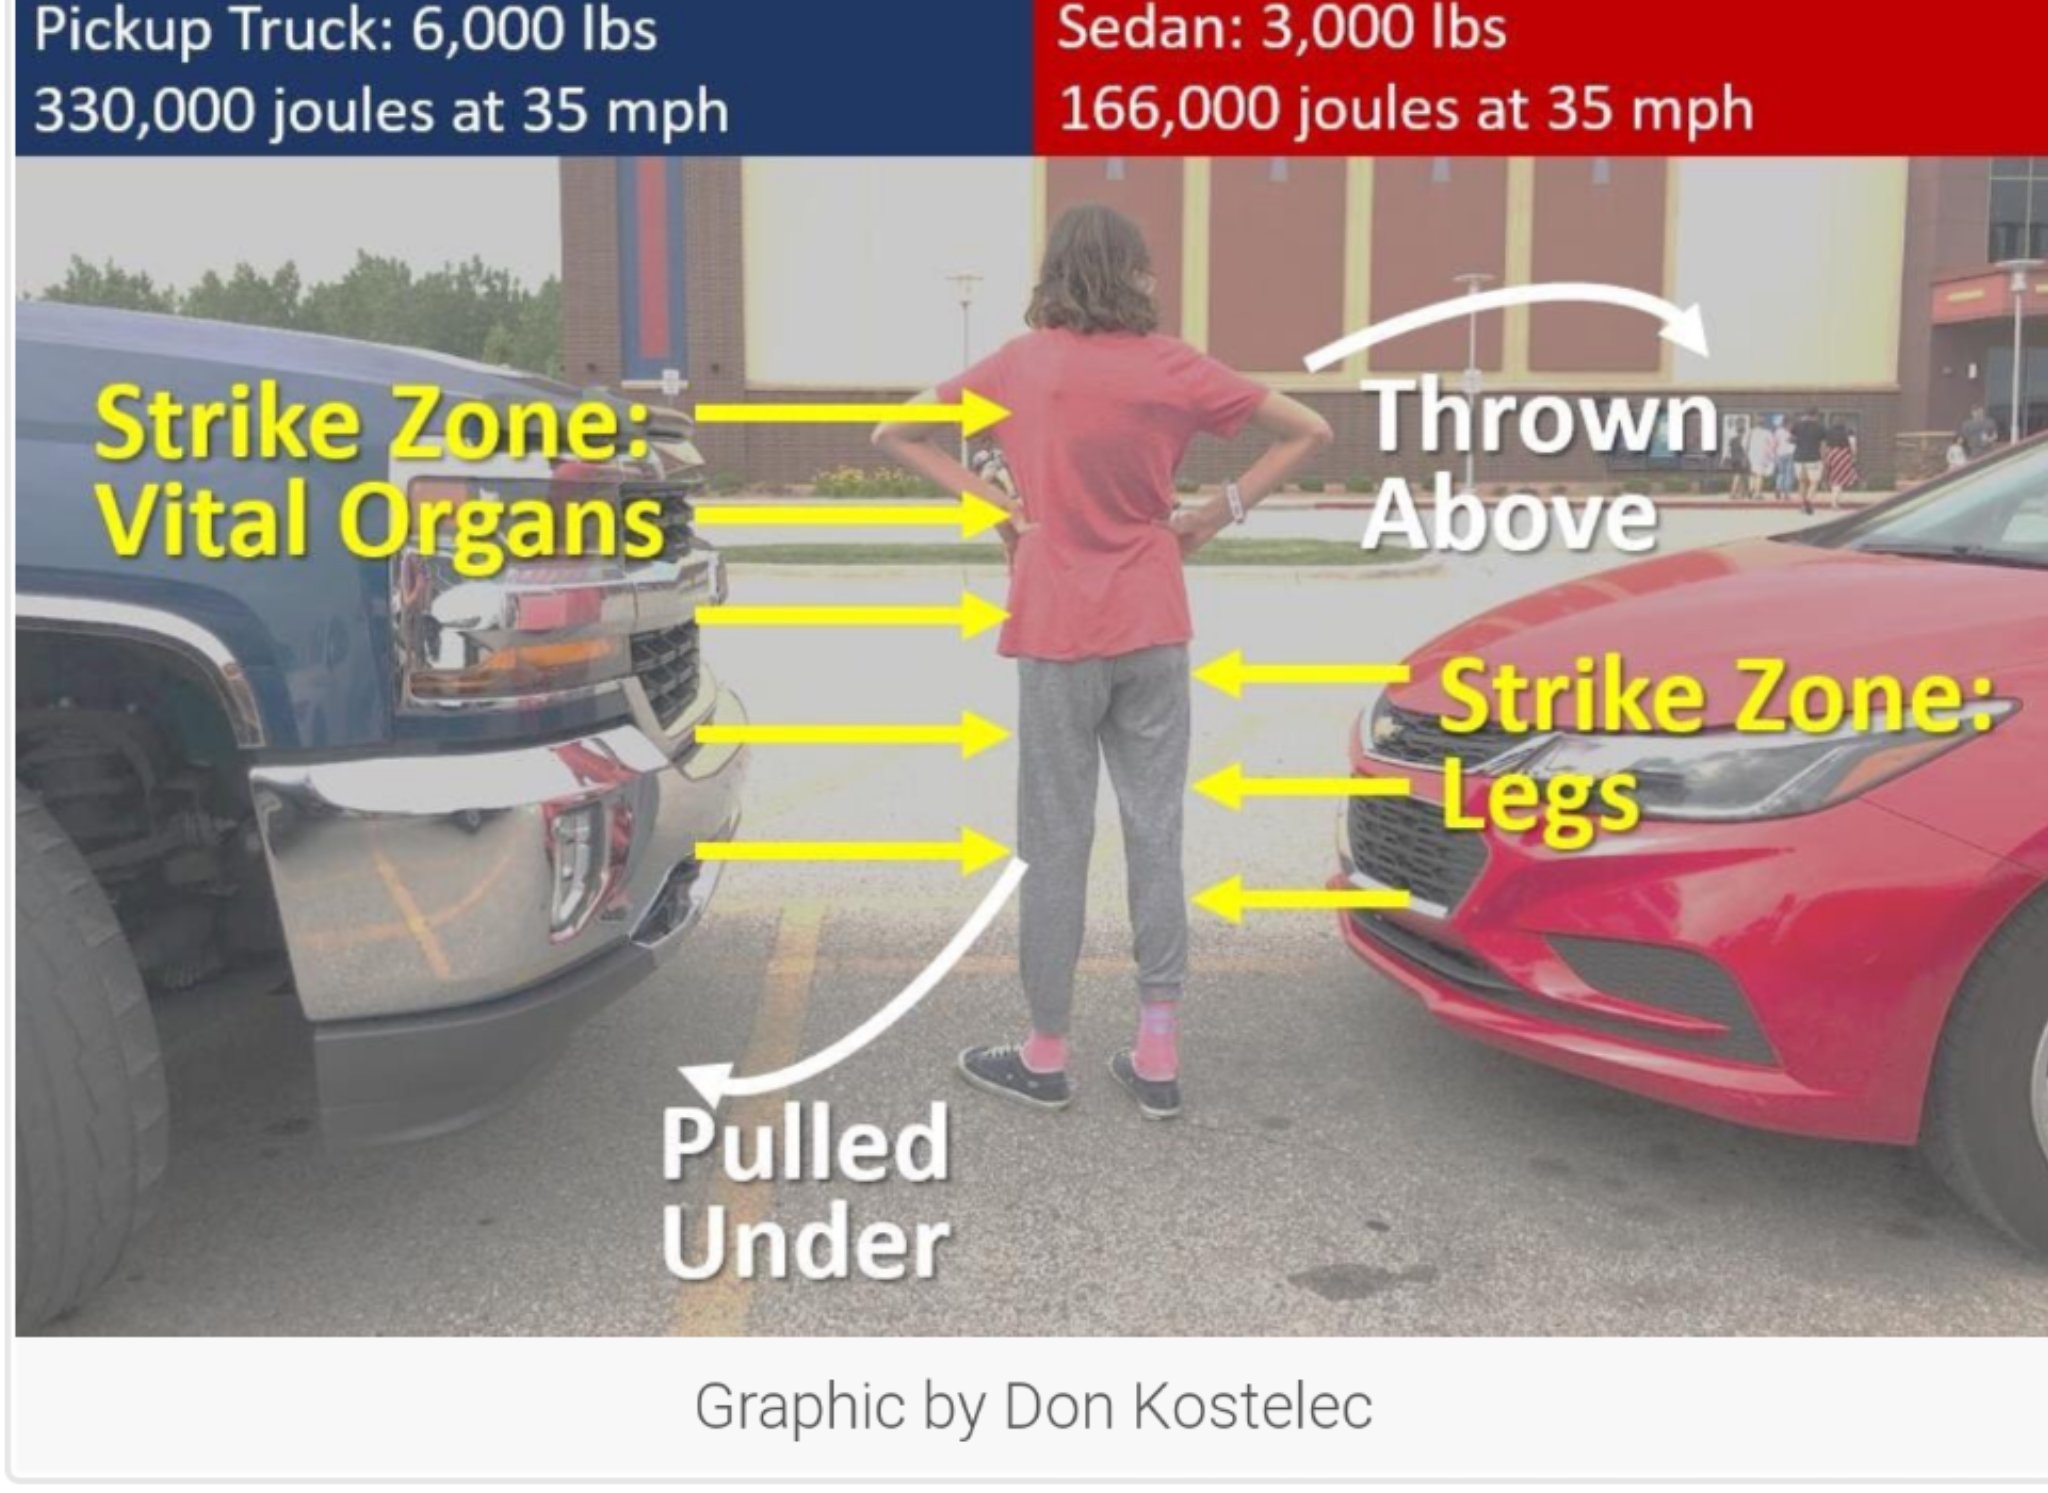
In fact, due to increased power and size of trucks and SUVs, in recent years, pedestrian crashes have become both deadlier and more frequent.
Between 2009 and 2016, SUVs had the biggest spike in single-vehicle fatal pedestrian crashes, jumping 81% over the eight-year period, according to the Insurance Institute for Highway Safety (IIHS).
“Their high-riding style, flat front ends, and higher total horsepower mean they are likely to strike pedestrians higher on victims’ bodies—at the chest rather than in the legs—and they do so with more force,” wrote Angie Schmitt with Streetsblog USA.
Unfortunately, auto safety regulators have never imposed standards that would impact how carmakers design vehicle bodies for the benefit of pedestrians.
While inadequate vehicle headlights are a concern, lack of street lighting is also a concern.
Between 2009 and 2016, pedestrian deaths increased 56% in the dark compared to 20% in daylight, according to the Insurance Institute for Highway Safety (IIHS).
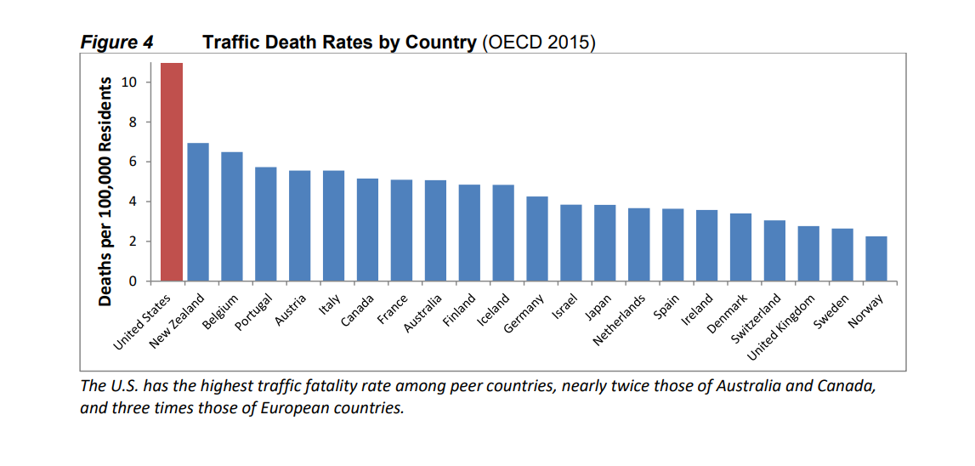
Although the U.S. has rigorous road and vehicle safety standards, and numerous traffic safety programs, it has the highest per capita traffic death rate among developed countries.
People in the US also drive far more than people in other developed countries; however, states are not punished for setting safety targets to increase deaths and serious injuries.
Moreover, states are not punished for failing to meet their roadway safety goals.
For example, in 2017, only eight states that set targets to improve safety actually achieved their targets.
Meanwhile, 18 states set targets to increase deaths and serious injuries and achieved or exceeded their targets.
Even the nation’s leading traffic safety strategy, Vision Zero, neglects strategies to reduce vehicle travel in favor of more targeted strategies.
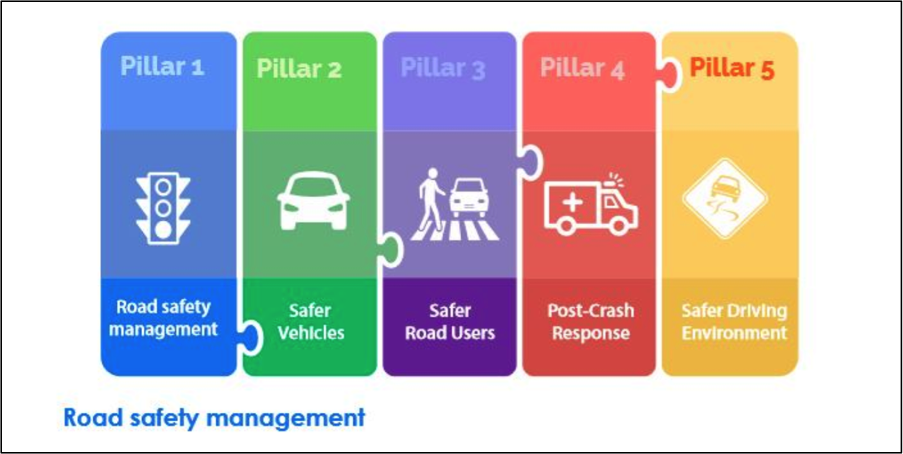 Safety advocates question the addition of a sixth pillar in Vision Zero’s five-pillar strategy—reduce vehicle travel.
Focusing on vehicle travel can promote health equity.
To improve safety, states and metropolitan areas should reduce vehicle travel and make roadways safer for all users.
4. Historical Focus on Reducing High-Risk Driving Rather Than on Reducing All Driving
Transportation professionals often emphasize that most crashes result from special risk factors, such as youth, senior, impaired or distracted driving.
Many conventional traffic safety strategies attempt to reduce higher-risk driving through targeted safety strategies, such as graduated licenses to reduce youth driving, special senior testing to identify high-risk drivers, and anti-impaired driving campaigns.
Beyond high-risk drivers, everyone is vulnerable to illusory superiority, where they consider themselves better than average.
Distracted walking has even been blamed as risky behavior. However, there haven’t been any peer-reviewed studies suggesting that distract walking is responsible for the growing number of pedestrian deaths and injuries or responsible for disparities in pedestrian deaths among older adults, people of color, and people walking in low-income communities, who are stuck and killed by drivers at higher rates.
Many of these targeted strategies are costly and provide few benefits beyond safety to a fraction of the population.
Efforts to reduce vehicle travel, like smart growth principles, however, have numerous social, environmental, and health benefits for entire populations.
“Some strategies, such as new urban rail systems, may seem costly considering just their traffic safety impacts, but provide other important benefits including reduced traffic and parking congestion, infrastructure savings, user savings and affordability, improved mobility for non-drivers, improved public fitness and health, energy conservation and emission reductions,” according to Litman.
 While costs and benefits of safety programs may be considered, additional risk to non-drivers and increased vehicle miles traveled per capita often are not.
“Communities can significantly increase safety and achieve many other planning objectives (reduced traffic and parking congestion, improved public health, infrastructure savings, increased affordability, more independent mobility for non-drivers, energy conservation, and emission reductions) by implementing more multi-modal planning, more efficient transportation pricing, targeted transport demand management programs, and Smart Growth development policies,” wrote Litman in Planetizen.
Unfortunately, states often dedicate more funding to deal with congestion than to deal with safety.
Traditional congestion mitigation strategies maximize traffic volumes and speeds, which increases total crashes and crash severity, thus reducing safety.
“When comparing roadway expansion or public transit improvements as possible congestion reduction strategies, conventional analysis usually ignores the additional risk to pedestrians and cyclists caused by wider roads and higher traffic speeds, additional crashes that result if roadway expansions induce additional vehicle travel, or increases in per capita traffic casualty rates if the highway expansion stimulates sprawled development,” according to Litman’s report.
 Surveys show repeatedly that many people would prefer to drive less and rely on alternative modes more, provided they are convenient, comfortable and affordable.
To improve safety, states and metropolitan areas should reduce vehicle travel and ensure that youths, seniors, drinkers and other vulnerable populations have suitable alternatives to driving.
What Else Can We Do toward Reform?
To reduce preventable injuries and premature death, transportation professionals should support systematic reforms, rather than just targeted strategies.
This requires a shift away from a historical focus on vehicles and vehicle throughput.
Download Litman’s new traffic safety paradigm strategies to reduce vehicle travel and crash rates.
Learn more about health equity challenges facing our transportation system.
Learn more about one transportation performance measure that reinforces a historical focus on vehicle travel.
You can also download a Salud America! Health Equity Report Card to find out average commute times, amounts of households with no vehicle, motor vehicle crash rate, and pedestrian-motor-vehicle crash mortality rates in your area!
Explore More:
Transportation & MobilityBy The Numbers
27
percent
of Latinos rely on public transit (compared to 14% of whites).