Share On Social!
We have updated our Salud America! Report Card to cover your county’s child opportunity score, environmental justice score, location affordability, and transit access.
The Report Card, first launched in 2017, auto-generates Latino and local data with interactive maps and comparative gauges, which can help you visualize and explore local inequities in housing, transit, poverty, health care, food, education, and more.
You will see how your county stacks up in these health improvement issues — now including child opportunity, location affordability, and transit access — compared to your state and the nation.
Then you can share the Report Card with your local leaders to shift from individualist thinking to advocating for systemic community change for health equity!
Get your Health Equity Report Card!
Why We Added Child Opportunity, Location Affordability, Transit Access to the Report Card
The social, economic, and environmental conditions in which live, learn, work, and play influence our health—and wealth.
Unfortunately, because of structural and challenges, Latinos and other people face difficulty accessing quality housing, transportation, medical care, food, jobs, schools, parks and other non-medical drivers and opportunities.
For example, because cities have prioritized automobile-dependent development and failed to provide adequate transportation options, Americans are forced to pay for personal vehicles just to get to work, school, the doctor, and the grocery store.
In Bexar County, Texas, for instance, the average household is spending 27% of their annual income on transportation. This is far more than the affordable threshold of 15%.
While housing may be affordable in Bexar County, transportation costs often eat up any savings on housing, further burdening families.
When burdened by transportation costs and lack of options, families are forced to make tradeoffs, such as foregoing spending on food and medications or skipping trips to essential destinations.
Thus, it is important to understand transportation cost burden, location affordability (average household spending on housing and transportation combined), and access to frequent transit.
It is also important to understand the symptoms of inadequate transportation and subsequent social, economic, and health consequences; however, because transportation success has been poorly operationalized, there are limited methods to assess transportation insecurity.
Furthermore, it is also important to understand neighborhood resources and conditions that matter for children’s healthy development (the Child Opportunity Index) and the cumulative impacts of environmental injustice on health and wellbeing (the Environmental Justice Index).
These conditions and impacts impose unfair challenges that hinder health improvement.
Because it is more efficient to remove challenges than to focus on individual efforts to overcome those challenges, it is essential to be aware of these challenges.
That’s why the Salud America! team first launched the Report Card in 2017.
We wanted to raise awareness about challenges and differences in social, economic, and health outcomes.
In 2021, we updated the Report Card to include the Social Vulnerability Index.
Now, we’re updating it again with even more data.
What You Can Find in the Updated Report Card
The Salud America! team updated the Report Card in 2023 with new local measurements for the Child Opportunity Index, Environmental Justice Index, School Segregation Index, transportation cost burden, location affordability (average household spending on transportation and housing combined), access to transit, expected annual fatalities from natural hazards, automobile debt in collections and medical debt in collections.
Each Report Card now includes local data, maps, and gauges on the following:
- Housing: Cost-burden, substandard, affordability, mortgage lending, etc.
- Schools: Graduation, reading proficiency, head start enrollment, etc.
- Transportation: Car-less households, crash mortality, cost burden, automobile debt in collections, ½ mile access to transit, ½ mile access to frequent transit, etc.
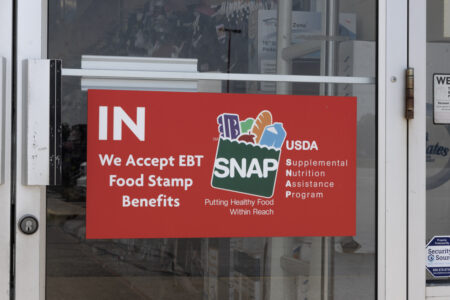
- Food: Food deserts, food access, food insecurity, fast food, grocery, SNAP, ect.
- Environment: Tree canopy, air toxin exposure, Environmental Justice Index, expected annual fatalities, and loss in agriculture and building damage from natural hazards, etc.
- Social and Economic: Income, poverty, no high-school diploma, violent crime, etc.
- Health care: Uninsured, access to primary, prenatal, mental health, dental care, etc.
- Physical and mental health: Diabetes, heart disease, obesity, asthma, cancer, premature death, Alzheimer’s, depression, social-emotional support, medical debt in collections, etc.
- Covid-19: Social Vulnerability Index, covid-19 deaths and vaccinations, etc.
- Opportunity: Child Opportunity Index, School Segregation Index, location affordability, and jobs reachable within ½ mile of a transit stop.
Another important addition to the Report Card is a page with information about the need for more complete local data, including community needs assessments, community health needs assessments, and improvement reports. Also, there is a call to action for better data collection, such as better data on adverse childhood experiences, transportation insecurity/precarity, and violent child death from guns and traffic crashes.
The Report Card continues to compare Latinos to Whites in key areas – including poverty, obesity, median household income, high-school diplomas, lack of health insurance, teen birth rates, and more – to demonstrate where health differences exist.
Each Report Card also contains links to evidence-based research and emerging ways local communities are addressing health differences to help you build a case toward long-term solutions.
“You can share an interactive version of your local Report Card with decision-makers to build the case to address existing differences in your community so that everyone has a fair, just opportunity to live their healthiest lives possible,” said Dr. Amelie G. Ramirez, director of the Salud America! Latino health improvement program at the Institute for Health Promotion Research in the Department of Population Health Sciences at UT Health San Antonio.
Explore More:
Access, Healthy Food, Housing, Transportation & Mobility, Understanding & Reducing PovertyBy The Numbers
23.7
percent
of Latino children are living in poverty