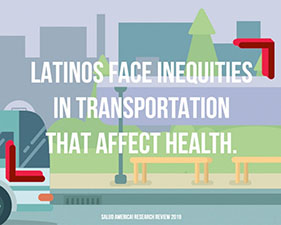
and poor health outcomes than non-Latino Whites.
Latino | Non-Latino White | |
---|---|---|
Children in Poverty | ||
Median Household Income | ||
No High School Diploma | ||
Uninsured Population | ||
Teen Birth Rates (per 1,000 pop.) | ||
Asthma Prevalence (state) | ||
Infant Mortality (per 1,000 birth) | ||
Mortality - Cancer (per 100,000 pop.) | ||
Motor Vehicle Crash Death Rate (per 100,000 pop.) | ||
Youth Obesity (state) |
In , of people are disproportionately burdened by higher housing costs (greater than 30% of household income). In your county, of housing is renter-occupied. Of households spending more than 30% of household income on housing costs, are rental households.
In , of people are severely cost-burdened, meaning they pay more than 50% of their annual income on housing. These families have less expendable income for healthy food, transportation, preventative healthcare, childcare, tutoring, higher education, museums, professional development, investing in small business, etc.
In , of housing units have one or more substandard conditions (lacking complete plumbing facilities, lacking complete kitchen facilities, with more than 1 occupant per room, and housing cost burden among renters and owners).
In order to afford the average-priced 2-bedroom home in , a person would have to work hours per week at average wage.
In , there are home purchase loan originations per 100,000 population. Of the total number of home purchase loan originations, were for Latinos compared to for non-Latino Whites, and were for under $120,000 compared to for over $200,000.
In , of persons aged 25 and older do not have a high school diploma (or equivalency). As you can see, there are disparities by census tract, which is a good indicator there are also disparities health, social, and economic outcomes. Interventions to improve high school graduation rates need to begin in the early years.
In , there are Head Start program facilities per 10,000 children under age 5.
Of preschool age children, are enrolled in public or private nursery/preschool. Enrollment varies by census tract, ranging from to .
In , the high school gratuation rate is . of the population ages 16-19 are not in school and not employed.
In , of children in grade 4 are scoring "not proficient" or worse in reading.
In , of public school students are eligible for Free/Reduced Price lunch. This assesses vulnerable populations which are more likely to have multiple health access, health status, and social support needs.
In , the average commute time is minutes; however, some families are commuting over 60 minutes to work. When families spend more time commuting, they have less time to spend investing in health and education.
In , of households do not have a motor vehicle. Older populations, Latinos and people of color, and people in low-income communities are disproportionately burdened by lack of safe streets and pedestrian fatalities and serious injuries, which are preventable. In your county, of workers travel to work by walking or biking, and commute by public transit.
In , of people commute over 60 minutes to work. In some areas commute over 60 minutes to work, while in other areas, commute over 60 minutes.
In , pedestrian deaths are due to motor vehicle crashes per 100,000 population.
In , deaths are due to motor vehicle crashes per 100,000 population. See page 1 for disparities in motor-vehicle crash death rate among Latinos and non-Latinos.
In , of the population has low food access, defined as living more than 1/2 mile from the nearest supermarket, supercenter, or large grocery store.
In your county, of households are food insecure (unable to meet food needs during at least 7 months of the year). Among children, are food insecure. These indicators provide measures of healthy food access and environmental influences on dietary behaviors.
In , there are fast food establishments per 100,000 people.
In , of the population is receiving Supplemental Nutrition Assistance Program (SNAP) benefits.
In , there are grocery stores per 100,000 population.
In , the average population density is person per square mile. Population density is higher in some urban areas and lower in rural areas. of the population is living in an urban area.
In , of the total working population (), work in construction; work in manufacturing; and work in agriculture, forestry or mining.
Workers in these fields, often Latinos, are at increased risked of exposure to hazards, toxins, and stressors; however, companies in these industries do not always provide health insurance. Latino workers are at a high risk for injury and can lack access to medical treatment.
In , of workers are insured through their employers; however, disparities exist. Employer provided insurance varies by census tract, ranging from to .
In , area is covered by tree canopy.
In , the cancer risk associated with air toxics exposure is per 1 million population. The rate varies from in one census tract to in another census tract.
The Respiratory Hazard Index Score for is . Scores over 1.0 indicate a potential for adverse health effects.
In , of the population has access to high-speed internet. Access to technology opens up opportunities for employment and education.
In , of individuals are living in households with income below the Federal Poverty Level (FPL). Poverty creates barriers to access including health services, healthy food, and other necessities that contribute to poor health status.
In , there are of persons aged 25 and older do not have a high school diploma (or equivalency). Higher educational attainment is linked to positive health, social, and economic outcomes.
In , violent crime offenses are reported to law enforcement per 100,000 residents. This includes homicide, rape, robbery, and aggravated assault.
In , of children aged 0-17 are living in households with income below the Federal Poverty Level. Poverty, unemployment, and lack of educational achievement affect access to care and a family's and community's ability to engage in healthy behaviors.
In , there are primary care physicians per 100,000 population.
In your county, of women do not obtain prenatal care during their first trimester of pregnancy.
In , there are mental health care providers per 100,000 population.
In , % of Medicare fee-for-service beneficiaries are readmitted to a hospital within 30 days of an initial hospitalization discharge.
In , there are dentists per 100,000 population.
In , of adults aged 20 and older have been diagnosed with diabetes.
In , of adults aged 18 and older have been diagnosed with coronary heart disease.
In , of adults aged 20 and older self-report that they have a Body Mass Index (BMI) greater than 30 (the medical definition of having obesity).
In , of Medicare fee-for-service population have been diagnosed with depression.
In , of adults aged 18 and older have been diagnosed with asthma.
In , the cancer incidence rate is cases per 100,000 population per year.
In , years of potential life lost before age 75 per 100,000 population for all causes of death.
In , of the Medicare fee-for-service population have been diagnosed with Alzheimer's disease.
In , the rate of death due to coronary heart disease is per 100,000 population.
In , of adults aged 18 and older report that they receive insufficient social and emotional support.
In , the Social Vulnerability Index Score is . The least vulnerable score is 0. The most vulnerable score is 1. Your area's score shows a level of vulnerability. Factors like poverty, lack of access to transportation and crowded housing may weaken a community's ability to prepare for and respond to hazardous events, such as natural disasters or disease outbreaks. Reducing social vulnerability can decrease both human suffering and economic loss.
has total confirmed COVID-19 deaths as of . The local mortality rate is per 100,000 population, which is than the state average of .
In , of residents are fully vaccinated against COVID-19 as of , compared to in the state. of local residents are hesitant against getting the vaccine. This is due to historical trauma/racism, mistrust of government, misinformation, and other factors.
has confirmed COVID-19 cases and a confirmed case rate of per 100,000 population as of . There were cases in the last 14 days ( - ) than 15-28 days ago. This time span comparison is important because it indicates a growing or declining case rate. Find the latest Latino COVID-19 case and death rates, and Latino vaccination rates in your state.
Email this report to colleagues and community leaders; share it on social media;
and bring printed copies to school or community meetings.
Explore case studies and stories of successful change-makers.
Explore research and resources to help you build your case.
Email Salud America! at saludamerica@uthscsa.edu.
Page | Indicator | Source |
---|
Share on social!